

Which of the following inequalities represents the graph above? (-4,0) (0,3) 0
Question:
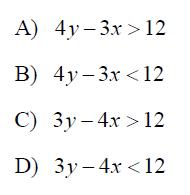
Which of the following inequalities represents the graph above?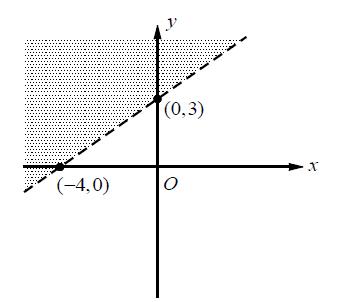
Fantastic news! We've Found the answer you've been seeking!
Step by Step Answer:
A Slope m of the boundary line is 30 m 3 The yintercept is 3 So the 04 4 3 slopeintercept form of t...View the full answer

Answered By
Pushpinder Singh
Currently, I am PhD scholar with Indian Statistical problem, working in applied statistics and real life data problems. I have done several projects in Statistics especially Time Series data analysis, Regression Techniques.
I am Master in Statistics from Indian Institute of Technology, Kanpur.
I have been teaching students for various University entrance exams and passing grades in Graduation and Post-Graduation.I have expertise in solving problems in Statistics for more than 2 years now.I am a subject expert in Statistics with Assignmentpedia.com.
3+ Reviews
10+ Question Solved
Related Book For 
Question Posted:
