

Which of the following inequalities represents the graph above? A) x+y -1 C) x+y-1 VIN D) x+y2-1
Question:
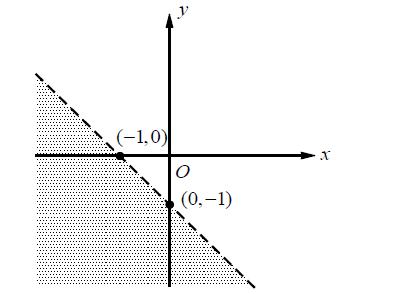
Which of the following inequalities represents the graph above?
Fantastic news! We've Found the answer you've been seeking!
Step by Step Answer:
A The slopeintercept form of the boundary line is yx1 The stand...View the full answer

Answered By
Muhammad Umair
I have done job as Embedded System Engineer for just four months but after it i have decided to open my own lab and to work on projects that i can launch my own product in market. I work on different softwares like Proteus, Mikroc to program Embedded Systems. My basic work is on Embedded Systems. I have skills in Autocad, Proteus, C++, C programming and i love to share these skills to other to enhance my knowledge too.
1+ Reviews
10+ Question Solved
Related Book For 

Question Posted:
