

Extend Example 3 as follows.(a) Verify the values in Table 21.13 and show them graphically as in
Question:
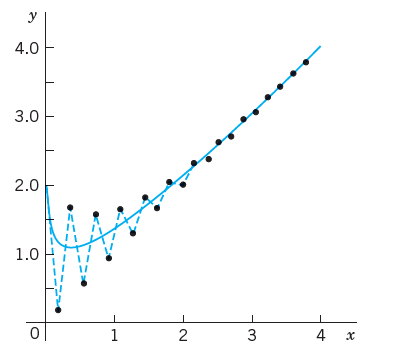
Extend Example 3 as follows.(a) Verify the values in Table 21.13 and show them graphically as in Fig. 452.
Data from Table 21.13
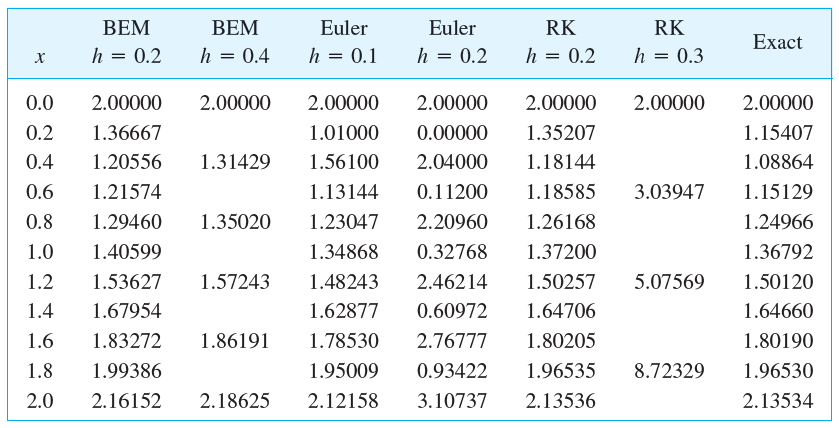
Fig 452
 (b) Compute and graph Euler values for h near the ?critical? h = 0.18 to determine more exactly when instability starts.
(c) Compute and graph RK values for values of h between 0.2 and 0.3 to find h for which the RK approximation begins to increase away from the exact solution.
(d) Compute and graph backward Euler values for large h; confirm stability and investigate the error increase for growing h.
Fantastic news! We've Found the answer you've been seeking!
Step by Step Answer:
U21 U23 ...View the full answer

Answered By
Gauri Hendre
I worked as EI educator for Eduphy India YT channel. I gave online tutorials to the students who were living in the villages and wanted to study much more and were preparing for NEET, TET. I gave tutions for topics in Biotechnology. I am currently working as a tutor on course hero for the biochemistry, microbiology, biology, cell biology, genetics subjects. I worked as a project intern in BAIF where did analysis on diseases mainly genetic disorders in the bovine. I worked as a trainee in serum institute of India and Vasantdada sugar institute. I am working as a writer on Quora partner program from 2019. I writing on the topics on social health issues including current COVID-19 pandemic, different concepts in science discipline. I learned foreign languages such as german and french upto A1 level. I attended different conferences in the science discipline and did trainings in cognitive skills and personality development skills from Lila Poonawalla foundation. I have been the member of Lila poonawalla foundation since 2017. Even I acquired the skills like Excel spreadsheet, MS Office, MS Powerpoint and Data entry.
4+ Reviews
10+ Question Solved
Related Book For 

Question Posted:
