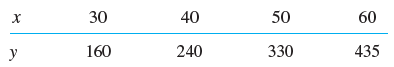
Find and graph the sample regression line of y on x and the given data as points
Question:
x = Speed [mph]. y = Stopping distance [ft]. Also ind y at 35 mph.
Transcribed Image Text:
30 40 50 60 435 330 y 160 240
Fantastic news! We've Found the answer you've been seeking!
Step by Step Answer:
Answer rating: 85% (7 reviews)
y 1205 915x y35 19975 The negative constant 1205 s...View the full answer
Answered By
Utsab mitra
I have the expertise to deliver these subjects to college and higher-level students. The services would involve only solving assignments, homework help, and others.
I have experience in delivering these subjects for the last 6 years on a freelancing basis in different companies around the globe. I am CMA certified and CGMA UK. I have professional experience of 18 years in the industry involved in the manufacturing company and IT implementation experience of over 12 years.
I have delivered this help to students effortlessly, which is essential to give the students a good grade in their studies.
3.50+
2+ Reviews
10+ Question Solved
Related Book For
Question Posted:
Students also viewed these Mathematics questions
-
Find and graph the discrete-time dynamical system for tail length. These data define several discrete-time dynamical systems. For example, between the first measurement (on day 0.5) and the second...
-
The regression of y on x has a prediction equation of y = -2.0 + 5.0x and a correlation of 0.3. Then, the regression of x on y a. Also has a correlation of 0.3. b. Could have a negative slope. c. Has...
-
Find a general solution. Show the details of your work y'1=4y2 y'2=4y1-16t^2+2
-
You are looking to help a small municipality finance their drinking water treatment facility with the installation of UV (ultraviolet) disinfection. The total cost of the project is estimated to be...
-
During the fourth quarter of 2017, ABBA Fabrics, Inc., elected to change its method of valuing inventory to the weighted average cost ("WAC") method, whereas in all prior years inventory was valued...
-
Ashley's Auto Top Carriers currently maintains plants in Atlanta and Tulsa that supply major distribution centers in Los Angeles and New York. Because of an expanding demand, Ashley has decided to...
-
Prepare a simple statement of financial position and interpret the information that it contains.
-
Balance sheet data for Otter Creek Company on December 31, the end of the fiscal year, are shown below. Prepare a comparative balance sheet for 2012 and 2011, stating each asset as a percent of total...
-
briefly describe and research & provide 2 real world examples of how organizations can leverage their marketing strategies to overcome the Managing To The Quarter syndrome. Your paper should include...
-
According to a survey of American households, the probability that the residents own 2 cars if annual household income is over $50,000 is 80%. Of the households surveyed, 60% had incomes over $50,000...
-
Why are cybercriminals increasingly targeting small businesses with their attacks?
-
AB Jackson Industries installed a compressor and pump system in 2010 at a cost of $87,200. If the FRED equipment cost index applies, what will be the estimated cost now for a similar system when the...
-
Which of the following are new introductions in UML 2? (a) Guards (b) Combined fragments (c) Interaction Occurrences (d) Frames
-
Vaughn Pharmaceuticals is evaluating its Vioxx division, an investment centre. The division has a $44800 controllable margin and $295000 of sales. How much will Vaughn's average operating assets be...
-
Consider a price floor in a market in which a firm has market power. Will a price floor ever result in an increase in total surplus? MC $50 40 40 30 20- 10 MR Demand 0 200 400 600 800 1000 Quantity
-
How do we ensure that efficiency improvements do not compromise employee satisfaction or lead to increased stress and burnout ?
-
Benson Company manufactures special metallic materials for luxury homes that require highly skilled labor. Benson uses standard costs to prepare its flexible budget. For the first quarter of the...
-
Project 2 Design Template Part1: Flowchart and Pseudocode/Algorithm: Here is the flowchart and pseudocode for Project2 program: Part2: Comprehensive Test Plan Test your program with at least two more...
-
Describe the basic features of the Saybolt Universal viscometer.
-
What tools are available to help shoppers compare prices, features, and values and check other shoppers opinions?
-
Reconsider the data from the previous study about the effect of specialized prenatal care for women with gestational diabetes. Do the data provide evidence of a relationship between the type of...
-
How would the p-value have changed if the alternative hypothesis was stated as: Alt: The long-run proportion of men who will call the researcher among those who cross the suspension bridge is...
-
Is random sampling or random assignment the more important consideration if the research question is whether students tend to receive higher scores on essays if they are encouraged to submit a draft...
-
How could I Identify and describe the segmentation of the workforce in a hospital setting (drawing up our study of how to differentiate employee groups depending on their drivers, such as flexible...
-
answer the following questions to help me further understand the text. 1. Identify the audience 2. Who needs the analysis of the text that you will communicate in your project? This will be the...
-
I need s fresh set of eyes with a new outlook on this same question that consistently tells me it's already been asked and do I want to unlock that answer. NO! I would like another expert to read my...
Study smarter with the SolutionInn App