

Take a sample, for instance, that in Prob. 4, and investigate and graph the effect of changing
Question:
Take a sample, for instance, that in Prob. 4, and investigate and graph the effect of changing y-values
(a) For small x
(b) For large x
(c) In the middle of the sample.
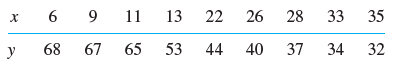
Data from Prob. 4
Find and graph the sample regression line of y on x and the given data as points on the same axes. Show the details of your work.
x = Deformation of a certain steel [mm], y = Brinell hardness [kg/mm2]
Fantastic news! We've Found the answer you've been seeking!
Step by Step Answer:
To investigate the effect of changing yvalues on the sample regression line and the given data we ca...View the full answer

Answered By
Darwin Romero
I use a hands-on technique and am approachable to my students. I incorporate fun into my lessons when possible. And while my easy-going style is suitable for many subjects and grades, I am also able to adapt my style to the needs of the student. I can describe myself as friendly, enthusiastic and respectful. As a teacher, we can easily get respect from the students if they would feel respected first
0 Reviews
10+ Question Solved
Related Book For 

Question Posted:
