

Consider, again, the transactions data of Alcoa stock on June 7, 2010. Focus on the transactions occurred
Question:
Consider, again, the transactions data of Alcoa stock on June 7, 2010. Focus on the transactions occurred during the normal trading hours.
(a) Obtain the price change series and its histogram.
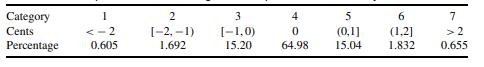
(b) Divide the price changes into seven categories as those in Table 6.3. What is the percentage of transactions with no price change?
(c) Fit an ordered probit model similar to that of Example 6.1 to the categorical price changes. Write down the fitted model.
(d) Fit an ADS model to the categorical price changes similar to Example 6.2. Write down the fitted model.
Table 6.3:
Example 6.1:
To illustrate, we consider again the intraday price changes of Caterpillar stock on January 4, 2010. There are 37,716 transactions during the normal trading hours so that we have 37,715 price changes. For simplicity, we classify the price change into seven categories as shown in Table 6.3. Our analysis focuses on the dynamic dependence of intraday price changes. As such, we define indicator (or dummy) variables for lagged price changes:
\[
y_{\ell, j}= \begin{cases}1 & \text { if } y_{i-\ell}=s_j \\ 0 & \text { otherwise, }\end{cases}
\]
where \(s_j\) denotes the \(j\) th category of price change and \(y_{i-\ell}\) is the \((i-\ell)\) th price change at time \(t_{i-\ell}\), where \(j=2, \ldots, 7\) and \(\ell=1\) and 2 . In other words, we employ the classifications of price changes for the previous two consecutive trades. As usual, with seven categories, only six indicator variables are needed.
Example 6.2:
We illustrate the decomposition model by analyzing, again, the intraday transactions of Caterpillar stock on January 4, 2010. As mentioned in Example 6.1, there are 37,715 price changes during the normal trading hours, and we classify the price changes into seven categories. To keep the model simple, we employ the following explanatory variables:
1. \(A_{i-1}\) : the action indicator of the previous trade (i.e., the \((i-1)\) th trade).
2. \(D_{i-1}\) : the direction indicator of the previous trade.
3. \(S_{i-1}\) : the size of the previous trade.
Step by Step Answer:


An Introduction To Analysis Of Financial Data With R
ISBN: 9780470890813
1st Edition
Authors: Ruey S Tsay
