

The cumulative discounted cash flow diagram for a process is shown in Figure P10.51; all numbers are
Question:
The cumulative discounted cash flow diagram for a process is shown in Figure P10.51; all numbers are given in $million and have been discounted to time t = 0. The project life is ten years after startup and the construction period is two years. The hurdle rate is 5% p.a. and the tax rate is 40% p.a. The 5-year MACRS (with a ½ year convention) was used for the depreciation calculations. For this project, answer the following questions. The answers for parts (a–d) should be given in terms of the cost or value at the time of purchase, that is, not the discounted value:
- What was the cost of land?
- What was the fixed capital investment excluding land, FCIL?
- What was the cost for working capital (WC)?
- What was the value for (R-COMd)?
- What is the discounted payback period (DPBP)?
- What is the net present value of the project (NPV)?
Figure P10.51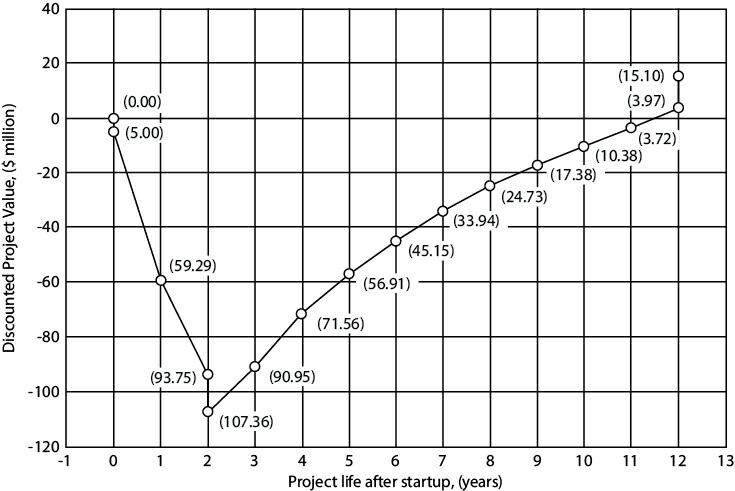
Fantastic news! We've Found the answer you've been seeking!
Step by Step Answer:

Answered By
Mahendra Singh
I completed post graduate in 2016 in m.tech (IT) . my teaching experience 4 years
0 Reviews
10+ Question Solved
Related Book For 
Analysis Synthesis And Design Of Chemical Processes
ISBN: 9780134177403
5th Edition
Authors: Richard Turton, Joseph Shaeiwitz, Debangsu Bhattacharyya, Wallace Whiting
Question Posted:
