

The residue curve map of Figure 12.9(a) shows that batch distillation of a mixture at the azeotropic
Question:
The residue curve map of Figure 12.9(a) shows that batch distillation of a mixture at the azeotropic composition for the system (A + B) with a small amount of C added will result in a very pure liquid C residue in the still. Is this a good separation unit choice to obtain “pure” C? Analyze the advantages and disadvantages.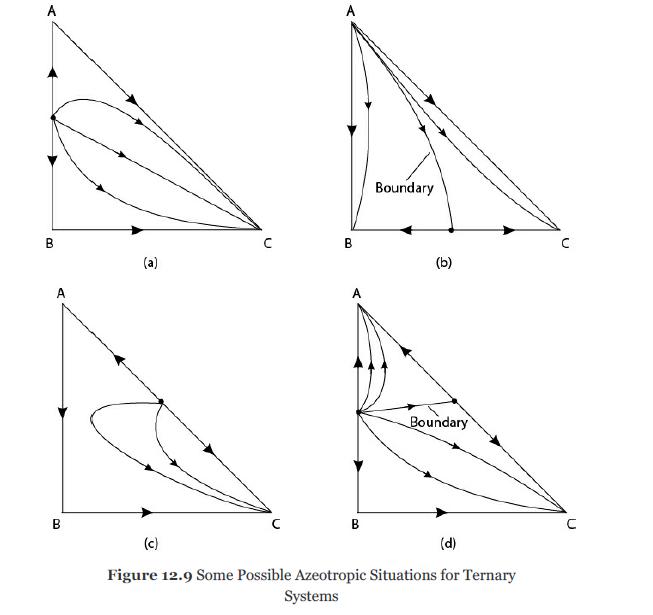
Fantastic news! We've Found the answer you've been seeking!
Step by Step Answer:
Advantages of using a batch distillation column to obtain pure C from a mixture of A B and C High purity Batch distillation can achieve very high puri...View the full answer

Answered By
Joram mutua
I am that writer who gives his best for my student/client. Anything i do, i give my best. I have tutored for the last five years and non of my student has ever failed, they all come back thanking me for the best grades. I have a degree in economics, but i have written academic papers for various disciplines due to top-notch research Skills.In additional, I am a professional copywriter and proofreader.
2+ Reviews
10+ Question Solved
Related Book For 
Analysis Synthesis And Design Of Chemical Processes
ISBN: 9780134177403
5th Edition
Authors: Richard Turton, Joseph Shaeiwitz, Debangsu Bhattacharyya, Wallace Whiting
Question Posted:
