

Figure 8.25 is a contour diagram for the sales of a product as a function of the
Question:
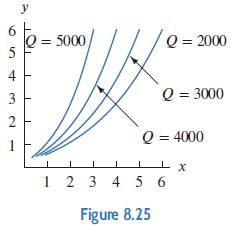
Figure 8.25 is a contour diagram for the sales of a product as a function of the price of the product and the amount spent on advertising. Which axis corresponds to the amount spent on advertising? Explain.
Fantastic news! We've Found the answer you've been seeking!
Step by Step Answer:
Using our economic intuition we know that the total sales of a pro...View the full answer

Answered By
Gabriela Rosalía Castro
I have worked with very different types of students, from little kids to bussines men and women. I have thaught at universities, schools, but mostly in private sessions for specialized purpuses. Sometimes I tutored kids that needed help with their classes at school, some others were high school or college students that needed to prepare for an exam to study abroud. Currently I'm teaching bussiness English for people in bussiness positions that want to improve their skills, and preparing and ex-student to pass a standarized test to study in the UK.
1+ Reviews
10+ Question Solved
Related Book For 

Applied Calculus
ISBN: 9781119275565
6th Edition
Authors: Deborah Hughes Hallett, Patti Frazer Lock, Andrew M. Gleason, Daniel E. Flath, Sheldon P. Gordon, David O. Lomen, David Lovelock, William G. McCallum, Brad G. Osgood, Andrew Pasquale
Question Posted:
