

Linear supply and demand curves are shown in Figure 1.66, with price on the vertical axis. (a)
Question:
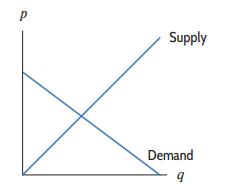
Linear supply and demand curves are shown in Figure 1.66, with price on the vertical axis.
(a) Label the equilibrium price p0 and the equilibrium quantity q0 on the axes.
(b) Explain the effect on equilibrium price and quantity if the slope, Δp∕Δq, of the supply curve increases. Illustrate your answer graphically.
(c) Explain the effect on equilibrium price and quantity if the slope, Δp∕Δq, of the demand curve becomes more negative. Illustrate your answer graphically.
Figure 1.66
Fantastic news! We've Found the answer you've been seeking!
Step by Step Answer:
a See Figure 137 b If the slope of the supply curve increases then the supply curve wi...View the full answer

Answered By
BRIAN MUSINGA
I possess a Bachelors of Commerce degree(Marketing option) and am currently undertaking an MBA in marketing. I believe that I possess the required knowledge and skills to tutor in the subject named. I have also written numerous research academic papers much to the satisfaction of clients and my professors.
2+ Reviews
17+ Question Solved
Related Book For 

Applied Calculus
ISBN: 9781119275565
6th Edition
Authors: Deborah Hughes Hallett, Patti Frazer Lock, Andrew M. Gleason, Daniel E. Flath, Sheldon P. Gordon, David O. Lomen, David Lovelock, William G. McCallum, Brad G. Osgood, Andrew Pasquale
Question Posted:
