

Table 6 gives the U.S. minimum wage in dollars for certain years. (a) Use the method of
Question:
Table 6 gives the U.S. minimum wage in dollars for certain years.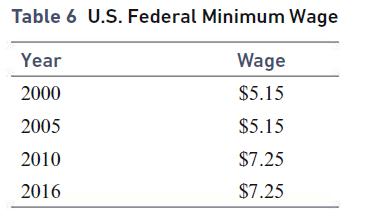
(a) Use the method of least squares to obtain the straight line that best fits these data.
(b) Estimate the minimum wage for the year 2008.
(c) If the trend determined by the straight line in part (a) continues, when will the minimum wage reach $10?
Fantastic news! We've Found the answer you've been seeking!
Step by Step Answer:
Given the table convert year to years after 2000 Then we have the data points 0 515 5 51...View the full answer

Answered By
Susan Juma
I'm available and reachable 24/7. I have high experience in helping students with their assignments, proposals, and dissertations. Most importantly, I'm a professional accountant and I can handle all kinds of accounting and finance problems.
15+ Reviews
45+ Question Solved
Related Book For 
Calculus And Its Applications
ISBN: 9780134437774
14th Edition
Authors: Larry Goldstein, David Lay, David Schneider, Nakhle Asmar
Question Posted:
