

The birth rate, B, in births per hour, of a bacteria population is given in Figure 6.15.
Question:
The birth rate, B, in births per hour, of a bacteria population is given in Figure 6.15. The curve marked D gives the death rate, in deaths per hour, of the same population.
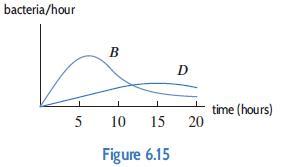 (a) Explain what the shape of each of these graphs tells you about the population.
(b) Use the graphs to find the time at which the net rate of increase of the population is at a maximum.
(c) At time t = 0 the population has size N. Sketch the graph of the total number born by time t. Also sketch the graph of the number alive at time t. Estimate the time at which the population is a maximum.
Step by Step Answer:
a In the beginning both birth and death rates are small this is consistent with a very small populat...View the full answer


Applied Calculus
ISBN: 9781119275565
6th Edition
Authors: Deborah Hughes Hallett, Patti Frazer Lock, Andrew M. Gleason, Daniel E. Flath, Sheldon P. Gordon, David O. Lomen, David Lovelock, William G. McCallum, Brad G. Osgood, Andrew Pasquale
