

The graph of f(t) is in Figure 5.33. Which of the following four numbers could be an
Question:
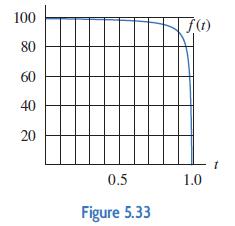
The graph of f(t) is in Figure 5.33. Which of the following four numbers could be an estimate of ∫10 f(t)dt accurate to two decimal places? Explain your choice.
I. −98.35 II. 71.84 III. 100.12 IV. 93.47
Fantastic news! We've Found the answer you've been seeking!
Step by Step Answer:
The graph given shows that f is positive for 0 t 1 Since the graph is contain...View the full answer

Answered By
Muhammad Umair
I have done job as Embedded System Engineer for just four months but after it i have decided to open my own lab and to work on projects that i can launch my own product in market. I work on different softwares like Proteus, Mikroc to program Embedded Systems. My basic work is on Embedded Systems. I have skills in Autocad, Proteus, C++, C programming and i love to share these skills to other to enhance my knowledge too.
1+ Reviews
10+ Question Solved
Related Book For 

Applied Calculus
ISBN: 9781119275565
6th Edition
Authors: Deborah Hughes Hallett, Patti Frazer Lock, Andrew M. Gleason, Daniel E. Flath, Sheldon P. Gordon, David O. Lomen, David Lovelock, William G. McCallum, Brad G. Osgood, Andrew Pasquale
Question Posted:
