

Using Table 8.4, graph heat index as a function of humidity with temperature fixed at 70F and
Question:
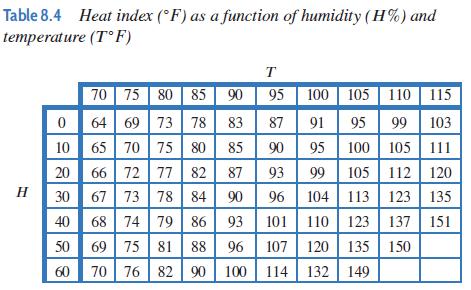
Using Table 8.4, graph heat index as a function of humidity with temperature fixed at 70◦F and at 100◦F. Explain the features of each graph and the difference between them in common-sense terms.
Fantastic news! We've Found the answer you've been seeking!
Step by Step Answer:
Both graphs are increasing because at any fixed temperature the air feels hotter as th...View the full answer

Answered By
Payal Mittal
I specialize in finance and accounts.You can ask any question related to til undergradution.Organizational behaviour and HRM are my favourites for you can always relate to them and is an art with practical knowledge base.
226+ Reviews
778+ Question Solved
Related Book For 

Applied Calculus
ISBN: 9781119275565
6th Edition
Authors: Deborah Hughes Hallett, Patti Frazer Lock, Andrew M. Gleason, Daniel E. Flath, Sheldon P. Gordon, David O. Lomen, David Lovelock, William G. McCallum, Brad G. Osgood, Andrew Pasquale
Question Posted:
