Fit an exponential model to Plot the data and the equation on both standard and semilogarithmic graphs
Question:
Fit an exponential model to
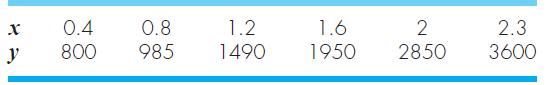
Plot the data and the equation on both standard and semilogarithmic graphs with the MATLAB subplot function.
Transcribed Image Text:
x 0.4 y 800 0.8 985 1.2 1490 1.6 1950 2 2850 2.3 3600
Fantastic news! We've Found the answer you've been seeking!
Step by Step Answer:
Answer rating: 60% (10 reviews)
Answered By
Ali Khawaja
my expertise are as follows: financial accounting : - journal entries - financial statements including balance sheet, profit & loss account, cash flow statement & statement of changes in equity -consolidated statement of financial position. -ratio analysis -depreciation methods -accounting concepts -understanding and application of all international financial reporting standards (ifrs) -international accounting standards (ias) -etc business analysis : -business strategy -strategic choices -business processes -e-business -e-marketing -project management -finance -hrm financial management : -project appraisal -capital budgeting -net present value (npv) -internal rate of return (irr) -net present value(npv) -payback period -strategic position -strategic choices -information technology -project management -finance -human resource management auditing: -internal audit -external audit -substantive procedures -analytic procedures -designing and assessment of internal controls -developing the flow charts & data flow diagrams -audit reports -engagement letter -materiality economics: -micro -macro -game theory -econometric -mathematical application in economics -empirical macroeconomics -international trade -international political economy -monetary theory and policy -public economics ,business law, and all regarding commerce
4.00+
1+ Reviews
10+ Question Solved
Related Book For
Applied Numerical Methods With MATLAB For Engineers And Scientists
ISBN: 9781259027437
3rd Edition
Authors: Steven C. Chapra
Question Posted:
Students also viewed these Mathematics questions
-
Fit an exponential model to Plot the data and the equation on both standard and semi-logarithmic graphpaper. 1.2 23 x0.4 08 800 975 1500 1950 2900 3600 2 1.6
-
The objective of this project is for modeling of categorical data using R. Two data sets are described below to investigate appropriate models (logistic and log-linear models). Both data sets have...
-
For the situation and variables in Exercise 17.7, fit an exponential model and use it to estimate the average room rate for a market in which the average occupancy rate is 70%. The underlying data...
-
A business had always made an allowance for doubtful debts at the rate of 2 per cent of accounts receivable. On 1 January 2011 the amount for this, brought forward from the previous year, was 300....
-
The manufacturer of Boston and Vermont asphalt shingles knows that product weight is a major factor in the customers perception of quality. Moreover, the weight represents the amount of raw materials...
-
Critically evaluate the following view expressed by Leamer: My interest in metastatistics [i.e., theory of inference actually drawn from data] stems from my observations of economists at work. The...
-
Let x represent the number of registers in use at a departmental store. Determine whether the random variable x is discrete or continuous. Explain.
-
Linda Madison owns Creations, a business that provides hair and nail care services in a small college town. Recently, Linda has decided to expand her business to include tanning and massage services...
-
To estimate the value of Paul's investment at maturity, calculate the number of years until Paul will go to university, and use compound interest to calculate the value of Paul's investment at that...
-
Develop an M-file function to compute descriptive statistics for a vector of values. Have the function determine and display number of values, mean, median, mode, range, standard deviation, variance,...
-
Modify the linregr function in Fig. 14.15 so that it (a) Computes and returns the standard error of the estimate, and (b) Uses the subplot function to also display a plot of the residuals (the...
-
In Exercises use graphs and tables to find (a) lim x (x) and (b) lim x - (x) (c) Identify all horizontal asymptotes. f(x) = X
-
3 A block of mass M-25 kg is attached to the cord wound on the drum of diameter 100 mm and it is allowed to fall under the action of gravity (see Figure B3). The drum is firmly attached to gear A,...
-
Why do we typically consider economies where the endowment when young is greater than the endowment when old? Consider a model economy as described in Module 1, but assume that workers are endowed...
-
Question 3 (20 marks) a). Let X, be iid, E(X) = and Var(X) = o. Set X = Xi/n. Show that i=1 n (X-X) 0 n i=1 (10 marks) b). Suppose X, x 1 are independent random variables and suppose that X, has...
-
6. If a company is implementing a Kanban system and has captured the following data, how many Kanbans do they need in their system? The company is conservative and does not want to run out of...
-
a). i) Define a field (also known as algebra) as used in the measure and probability theory. State the conditions that a given filed say A must meet in order to be a field. (4 marks) ii) Consider a...
-
What are the four types of tests of controls? Explain them and comment on the reliability of the evidence obtained from each.
-
In Exercises 516, find the focus and directrix of the parabola with the given equation. Then graph the parabola. y 2 = 4x
-
Solve the following problem with the fourth-order RK method: d2y/dx2 + 0.6 dy/dx + 8y = 0 where y(0) = 4 and y(0)= 0. Solve from x = 0 to 5 with h = 0.5. Plot your results.
-
Solve from t = 0 to 3 with h = 0.1 using (a) Heun (without corrector) and (b) Ralstons 2nd-order RK method: dy/dt = y sin3(t)y(0) = 1
-
Solve the following problem numerically from t = 0 to 3: dy/dx = - y + t2 y(0) = 1 Use the third-order RK method with a step size of 0.5.
-
Consider a rectangular wing mounted in a low - speed subsonic wind tunnel. The wing model completely spans the test section so that the flow sees essentially an infinite wing. If the wing has an NACA...
-
Draw a Sankey Diagram of the energy flow to power an electric vehicle. Normalize the energy consumption of the vehicle to 1 ( that is , the width of the vehicle energy consumption flow will be 1...
-
A car runs on wheels of diameter 3 5 0 mm . The car is travelling at an average speed of 7 5 km / h , what is the angular velocity of the wheels?
Study smarter with the SolutionInn App