

The loglog function operates in an identical fashion to the plot function except that logarithmic scales are
Question:
The loglog function operates in an identical fashion to the plot function except that logarithmic scales are used for both the x and y axes. Use this function to plot the data and function as described in Prob. 2.13. Explain the results.
Data From Problem 2.13
Here are some wind tunnel data for force (F) versus velocity (ν):
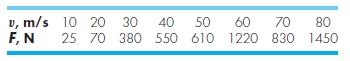
These data can be described by the following function:
F = 0.2741ν1.9842
Use MATLAB to create a plot displaying both the data (using circular magenta symbols) and the function (using a black dash-dotted line). Plot the function for v = 0 to 100 m/s and label the plot’s axes.
Fantastic news! We've Found the answer you've been seeking!
Step by Step Answer:
Define the velocity range from 0 to 100 ms with a step size of 01 ms Define the function F as F 0274...View the full answer

Answered By
Brian Kiprono
Taking part in public speeches, blogging, writing essays
0 Reviews
10+ Question Solved
Related Book For 
Applied Numerical Methods With MATLAB For Engineers And Scientists
ISBN: 9781259027437
3rd Edition
Authors: Steven C. Chapra
Question Posted:
