

A company measures customer satisfaction in three regions, producing the following crosstab: (a) What percentage of respondents
Question:
A company measures customer satisfaction in three regions, producing the following crosstab: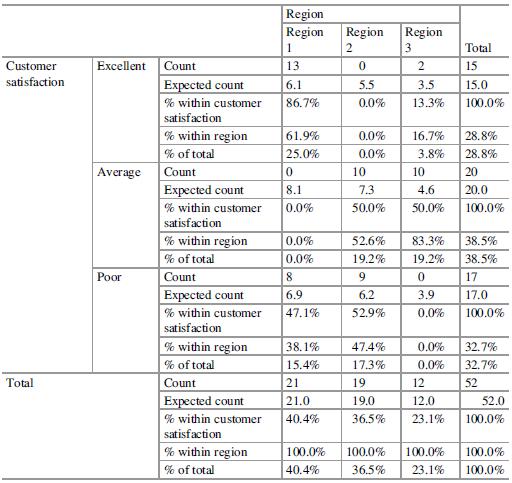
(a) What percentage of respondents answering “good” come from region 3?
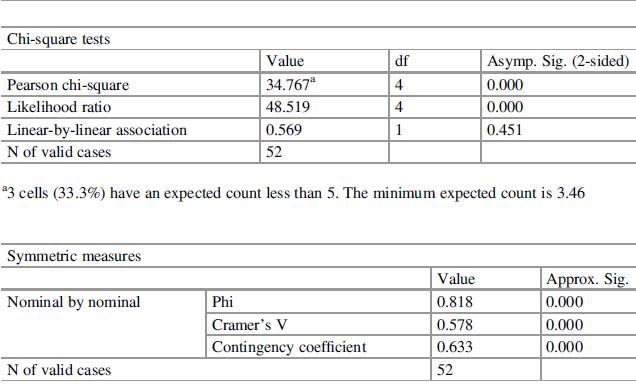
(b) Interpret the strength of the association and assess the suitability of the phi coefficient, Cramer’s V, and the contingency coefficient for solving the problem.
Discuss possible problems when using the permitted measures of association and indicate regions with above-average numbers of satisfied or dissatisfied respondents.
Fantastic news! We've Found the answer you've been seeking!
Step by Step Answer:
a Region Region3assessment good 215100 133 b Phi is unsuited as the contingency table has more tha...View the full answer

Answered By
PALASH JHANWAR
I am a Chartered Accountant with AIR 45 in CA - IPCC. I am a Merit Holder ( B.Com ). The following is my educational details.
PLEASE ACCESS MY RESUME FROM THE FOLLOWING LINK: https://drive.google.com/file/d/1hYR1uch-ff6MRC_cDB07K6VqY9kQ3SFL/view?usp=sharing
3+ Reviews
10+ Question Solved
Related Book For 
Applied Statistics And Multivariate Data Analysis For Business And Economics
ISBN: 9783030177669
1st Edition
Authors: Thomas Cleff
Question Posted:
