

A used car market contains 200 vehicles across the following price categories: (a) Draw a histogram for
Question:
A used car market contains 200 vehicles across the following price categories: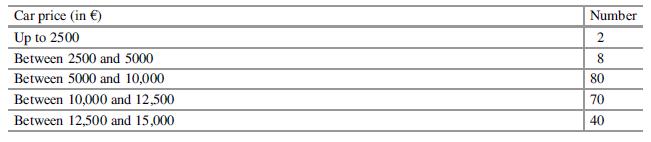
(a) Draw a histogram for the relative frequencies. How would you have done the data acquisition differently?
(b) Calculate and interpret the arithmetic mean, the median, and the modal class.
(c) What price is reached by 45% of the used cars?
(d) 80% of used cars in a different market are sold for more than €11,250. Compare this value with the market figures in the above table.
Fantastic news! We've Found the answer you've been seeking!
Step by Step Answer:
Relative Frequency Number of Vehicles in Category Total Number of Vehicles a Histogra...View the full answer

Answered By
Bhartendu Goyal
Professional, Experienced, and Expert tutor who will provide speedy and to-the-point solutions. I have been teaching students for 5 years now in different subjects and it's truly been one of the most rewarding experiences of my life. I have also done one-to-one tutoring with 100+ students and help them achieve great subject knowledge. I have expertise in computer subjects like C++, C, Java, and Python programming and other computer Science related fields. Many of my student's parents message me that your lessons improved their children's grades and this is the best only thing you want as a tea...
2+ Reviews
10+ Question Solved
Related Book For 
Applied Statistics And Multivariate Data Analysis For Business And Economics
ISBN: 9783030177669
1st Edition
Authors: Thomas Cleff
Question Posted:
