

A back-to-back stem-and-leaf display on two data sets is conducted by hanging the data on both sides
Question:
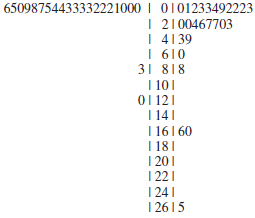
How does the back-to-back stem-and-leaf display show the differences in the data set in a way that the dotplot cannot?
Fantastic news! We've Found the answer you've been seeking!
Step by Step Answer:
A backtoback steamandleaf display is useful when t...View the full answer

Answered By
Utsab mitra
I have the expertise to deliver these subjects to college and higher-level students. The services would involve only solving assignments, homework help, and others.
I have experience in delivering these subjects for the last 6 years on a freelancing basis in different companies around the globe. I am CMA certified and CGMA UK. I have professional experience of 18 years in the industry involved in the manufacturing company and IT implementation experience of over 12 years.
I have delivered this help to students effortlessly, which is essential to give the students a good grade in their studies.
2+ Reviews
10+ Question Solved
Related Book For 

Applied Statistics And Probability For Engineers
ISBN: 9781118539712
6th Edition
Authors: Douglas C. Montgomery, George C. Runger
Question Posted:
