

An article in Technometrics by S. C. Narula and J. F. Wellington [Prediction, Linear Regression, and a
Question:
(a) Assuming that a simple linear regression model is appropriate, obtain the least squares fit relating selling price to taxes paid. What is the estimate of σ2?
(b) Find the mean selling price given that the taxes paid are x = 7.50. TABLE 11-2 House Data
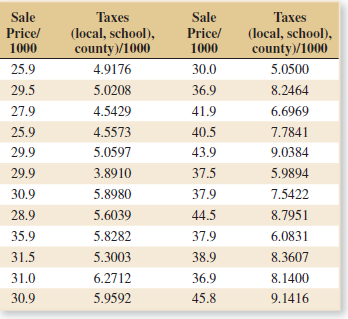
(c) Calculate the fitted value of y corresponding to x = 5.8980. Find the corresponding residual.
(d) Calculate the fitted yi for each value of xi used to fit the model. Then construct a graph of yi versus the corresponding observed value yi and comment on what this plot would look like if the relationship between y and x was a deterministic (no random error) straight line. Does the plot actually obtained indicate that taxes paid is an effective regressor variable in predicting selling price?
Step by Step Answer:
a Regression Analysis Linear model Y abX b c d All the points would lie alon...View the full answer


Applied Statistics And Probability For Engineers
ISBN: 9781118539712
6th Edition
Authors: Douglas C. Montgomery, George C. Runger
