

Consider the purity data in Exercise 15-74. Use Ï = 0.8 and assume that the desired process
Question:
(a) Construct an EWMA control chart with λ = 0.2. Does the process appear to be in control?
(b) Construct an EWMA control chart with λ = 0.5. Compare your results to part (a).
(c) Suppose that the next five observations are 90.75, 90.00, 91.15, 90.95, and 90.86. Apply the EWMAs in part (a) and (b) to these new observations. Is there any evidence that the process has shifted out of control?
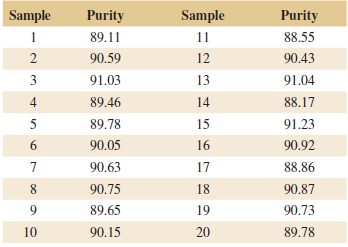
Exercise 15-74
The purity of a chemical product is measured every two hours. The results of 20 consecutive measurements are as follows:
Fantastic news! We've Found the answer you've been seeking!
Step by Step Answer:
a The process appears to be ...View the full answer

Answered By
Jagan Mohan
Worked as tutor in a school for 10th class students
0 Reviews
10+ Question Solved
Related Book For 

Applied Statistics And Probability For Engineers
ISBN: 9781118539712
6th Edition
Authors: Douglas C. Montgomery, George C. Runger
Question Posted:
