

The following data were considered in Quality Progress [Digidot Plots for Process Surveillance (1990, May, pp. 6668)].
Question:
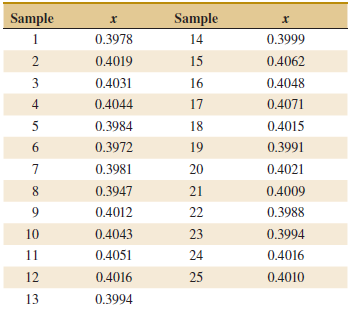
(a) Construct a CUSUM scheme for this process with the target μ0 = 0.4. Explain how you determined your estimate of σ and the CUSUM parameters H and K. Is the process in control?
(b) Construct an EWMA control chart with λ= 0.5 and L = 3 and compare your conclusions to part (a).
Fantastic news! We've Found the answer you've been seeking!
Step by Step Answer:
a Here is estimated using the moving range 00026112800023 ...View the full answer

Answered By
Rohith Bellamkonda
I am studying in IIT Indore,the most prestigious institute of India.I love solving maths and enjoy coding
1+ Reviews
10+ Question Solved
Related Book For 

Applied Statistics And Probability For Engineers
ISBN: 9781118539712
6th Edition
Authors: Douglas C. Montgomery, George C. Runger
Question Posted:
