

Use the football data in Exercise 12-21 to build regression models using the following techniques: (a) All
Question:
(a) All possible regressions. Find the equations that minimize MSE and that minimize Cp.
(b) Stepwise regression.
(c) Forward selection.
(d) Backward elimination.
(e) Comment on the various models obtained. Which model seems €œbest,€™€™ and why?
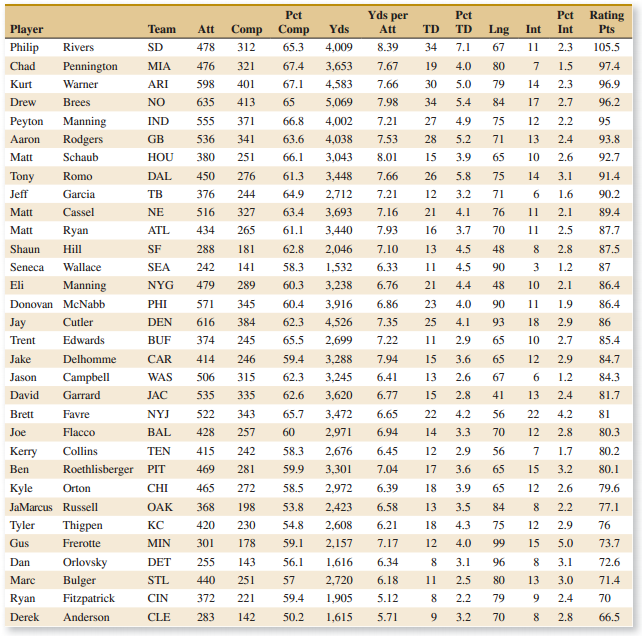
Exercise 12-21
Table E12-11 presents quarterback ratings for the 2008 National Football League season (The Sports Network).
Fantastic news! We've Found the answer you've been seeking!
Step by Step Answer:
a The computer output follows The first model in the table with seven variables minimizes MS E and C...View the full answer

Answered By
Zablon Gicharu
I am an educator who possesses the requisite skills and knowledge due to interacting with students for an extended period. I provide solutions to various problems in step-by-step explanations, a well-thought approach and an understandable breakdown. My goal is to impart more straightforward methodologies and understanding to students for more remarkable achievements.
4+ Reviews
10+ Question Solved
Related Book For 

Applied Statistics And Probability For Engineers
ISBN: 9781118539712
6th Edition
Authors: Douglas C. Montgomery, George C. Runger
Question Posted:
