

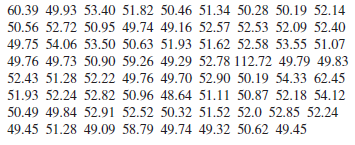
Using the data from Exercise 6-24 on swim times, (a) Find the median and quartiles for the
Question:
(a) Find the median and quartiles for the data.
(b) Make a box plot of the data.
(c) Repeat (a) and (b) for the data without the extreme outlier and comment.
(d) Compare the distribution of the data with and without the extreme outlier.
Data from 6-24
The word "distribution" has several meanings in the financial world, most of them pertaining to the payment of assets from a fund, account, or individual security to an investor or beneficiary. Retirement account distributions are among the most...
Fantastic news! We've Found the answer you've been seeking!
Step by Step Answer:
a Descriptive Statistics Variable Mean SE Mean StDev Minimum Q1 Median Q...View the full answer

Answered By
Branice Buyengo Ajevi
I have been teaching for the last 5 years which has strengthened my interaction with students of different level.
1+ Reviews
10+ Question Solved
Related Book For 

Applied Statistics And Probability For Engineers
ISBN: 9781118539712
6th Edition
Authors: Douglas C. Montgomery, George C. Runger
Question Posted:
