

Stoplights S 1 and S 2 can each be in one of two states: green (g) or
Question:
Stoplights S1 and S2 can each be in one of two states: green (g) or red (r). Additionally, the machinery behind both stoplights (W) can be in one of two states: working (w) or broken (b). We collect data by observing the stoplights and the state of their machinery on seven different days. Here is a Na¨ıve Bayes graphical model for the stoplights:
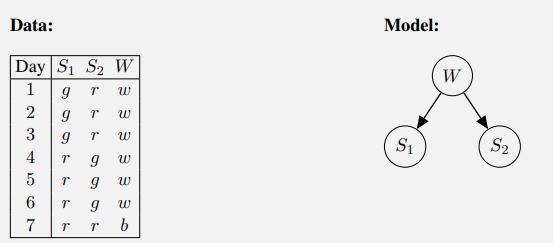
a. Write the probability tables for P(W), P(S1|W), P(S2|W) with the naive Bayes joint distribution that assigns highest probability to the data we observed.
b. What’s the posterior probability P(W = b|S1 = r, S2 = r)?
c. Instead of Na¨ıve Bayes, we use the following graphical model and fill in probability tables with estimates that assign highest probability to the data we observed:
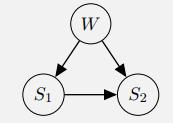
(i) What’s the posterior probability P(W = b|S1 = r, S2 = r)?
(ii) What is it about the problem that makes the second graphical model more suitable than the first?
Step by Step Answer:
a b c i ii S 1 and S 2 are not conditionally independent given W in t...View the full answer


Artificial Intelligence A Modern Approach
ISBN: 9780134610993
4th Edition
Authors: Stuart Russell, Peter Norvig
