

Consider the graph of the normal distribution in Figure 14, which illustrates the relative frequencies in a
Question:
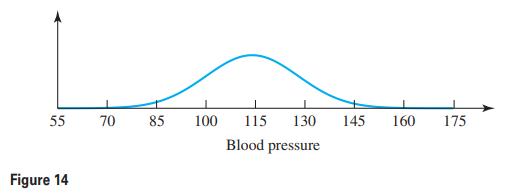
Consider the graph of the normal distribution in Figure 14, which illustrates the relative frequencies in a distribution of systolic blood pressures for a sample of female students. The distribution has a standard deviation of 14.
a. What is the mean of the distribution?
b. Estimate (using area) the percentage of students whose blood pressure is less than 100.
c. Estimate the percentage of students whose blood pressure is between 110 and 130.
d. Estimate the percentage of students whose blood pressure is greater than 130.
Step by Step Answer:

This question has not been answered yet.
You can Ask your question!
Related Book For 
Statistical Reasoning For Everyday Life
ISBN: 9780321904645
4th International Edition
Authors: Jeffrey Bennett, William L. Briggs, Mario F. Triola
Question Posted:
