

Constant Dollars. The graph in Figure 41 shows the minimum wage in the United States, together with
Question:
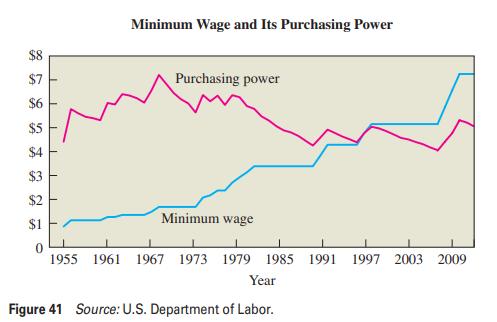
Constant Dollars. The graph in Figure 41 shows the minimum wage in the United States, together with its purchasing power, which is adjusted for inflation with 1996 used as the reference year. The graph represents the years from 1955 to 2011. Summarize what the graph shows.
Fantastic news! We've Found the answer you've been seeking!
Step by Step Answer:
The actual minimum wage in unadjusted dollars has either remai...View the full answer

Answered By
BETHUEL RUTTO
Hi! I am a Journalism and Mass Communication graduate; I have written many academic essays, including argumentative essays, research papers, and literary analysis. I have also proofread and written reviews, summaries and analyses on already finished works. I am eager to continue writing!
1+ Reviews
10+ Question Solved
Related Book For 
Statistical Reasoning For Everyday Life
ISBN: 9780321904645
4th International Edition
Authors: Jeffrey Bennett, William L. Briggs, Mario F. Triola
Question Posted:
