

Mark Lines is an online portal (www.marklines.com) that reports automotive industry data. The table below shows the
Question:
Mark Lines is an online portal (www.marklines.com) that reports automotive industry data. The table below shows the number of cars sold in the United States in 2018 and 2019. The top 22 manufacturers, plus others, are listed here. Sales data often are reported in this way to compare current sales to last year’s sales.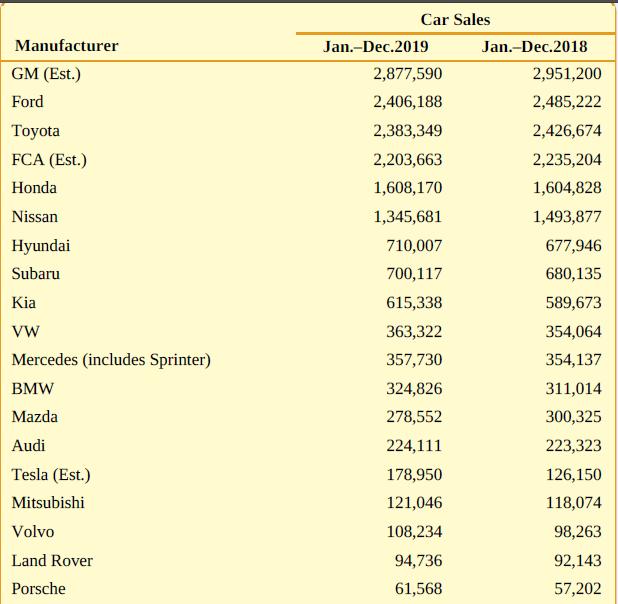
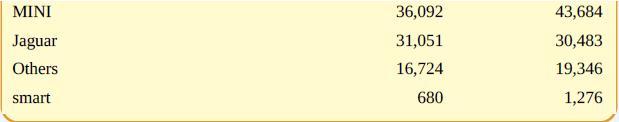
Using computer software, compare 2018 sales to the 2019 sales for each manufacturer by computing the difference. Make a list of the manufacturers that increased sales from 2018 to 2019; make a list of manufacturers that decreased sales. Using computer software, compare 2018 sales to 2019 sales for each manufacturer by computing the percentage change in sales. Make a list of the manufacturers in order of increasing percentage changes. Which manufacturers are in the top five in percentage change? Which manufacturers are in the bottom five in percentage change? Using computer software, first sort the data using the 2019 year-to-date sales. Then, design a bar graph to illustrate the 2018 and 2019 year-to-date sales for the top 10 manufacturers. Also, design a bar graph to illustrate the percentage change for the top 10 manufacturers. Compare these two graphs and prepare a brief written report.
Step by Step Answer:
To compare 2018 sales to 2019 sales for each manufacturer the difference between the two values can ...View the full answer


Basic Statistics In Business And Economics
ISBN: 9781260597578
10th Edition
Authors: Douglas A. Lind, William G. Marchal, Samuel A. Wathen
