

Graph the function if the given changes are made in the indicated examples of this section. In
Question:
Graph the function if the given changes are made in the indicated examples of this section.
In Example 4, if the sign of the coefficient of sin x is changed, display the graph of the resulting function.
Data from Example 4
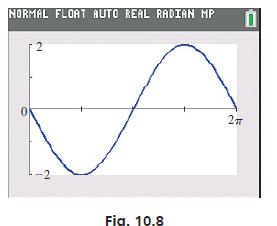
A certain water wave can be represented by the equation y = −2 sin x (measurements in ft). Display the graph on a calculator. Using radian mode on the calculator, Fig. 10.8 shows the calculator view for the key values in the following table:
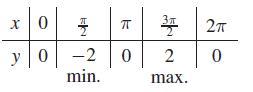
We see the amplitude of 2 and the effect of the negative sign in inverting the curve.
Fantastic news! We've Found the answer you've been seeking!
Step by Step Answer:
We are changing the sign of the coefficient of sinxit becomes then y ...View the full answer

Answered By
Rishi Anand
Hello and welcome to my profile.Let me introduce myself.I am Laiba Ayyub.I am Master degree holder.I got my Masters degree in Mathematics from Riphah International University Islamabad.I have been a good student.I am teaching many students right now.I taught in a High private school in my city.I also take classes in evening from class 8th to 14th.I am expert in doing maths.I believe in students satisfaction.
0 Reviews
10+ Question Solved
Related Book For 

Basic Technical Mathematics
ISBN: 9780137529896
12th Edition
Authors: Allyn J. Washington, Richard Evans
Question Posted:
