

In Example 1, change the sign before 6x to +. Data from Example 1 Graph the
Question:
In Example 1, change the − sign before 6x to +.
Data from Example 1
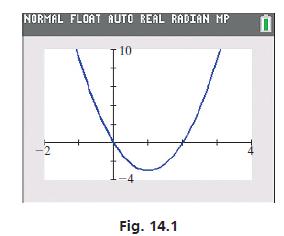
Graph the equation y = 3x2 − 6x.
We graphed equations of this form in Section 7.4. Because the general quadratic function is y = ax2 + bx + c, for y = 3x2 − 6x, we have a = 3, b = −6, and c = 0. Therefore, −b (2a) = 1, which means the x-coordinate of the vertex is −(−6)/6 = 1. Because y = −3 for x = 1, the vertex is (1, −3). It is a minimum point since a > 0. Knowing the vertex and the fact that the graph goes through the origin (c = 0), we choose appropriate window settings and have the display shown in Fig. 14.1.
As we showed in Section 7.4, the curve is a parabola, and a parabola always results if the equation is of the form of the quadratic function y = ax2 + bx + c.
Step by Step Answer:
After changing the sign before 6x to the equation becomes y 3x2 6x To find th...View the full answer


Basic Technical Mathematics
ISBN: 9780137529896
12th Edition
Authors: Allyn J. Washington, Richard Evans
