

In Example 2, change the first subgroup to 497, 499, 502, 493, and 498 and then proceed
Question:
In Example 2, change the first subgroup to 497, 499, 502, 493, and 498 and then proceed as directed.
How would the R control chart differ from the bottom graph in Fig. 22.20?
Data from Example 2
A pharmaceutical company makes a capsule of a prescription drug that contains 500 mg of the drug, according to the label. In a newly modified process of making the capsule, five capsules are tested every 15 min to check the amount of the drug in each capsule. Testing over a 5-h period gave the following results for the 20 subgroups of samples.
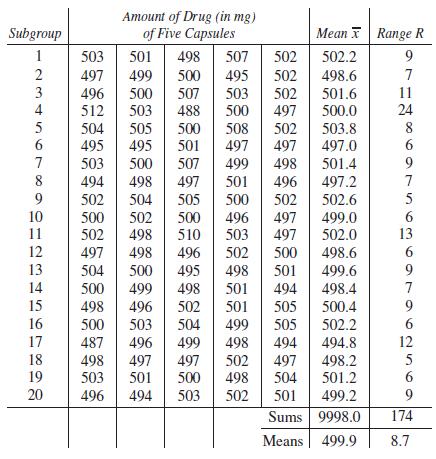
As we noted from the table, the range R of each sample is the difference between the highest value and the lowest value of the sample. From this table of values, we can make an x̄ control chart and an R control chart. The x̄ chart maintains a check on the average quality level, whereas the R chart maintains a
check on the dispersion of the production process. These two control charts are often plotted together and referred to as the x̄ –R chart. In order to define the central line of the x̄ chart, which ideally is equivalent to the value of the population mean μ, we use the mean of the sample means x̄ . For the central line of the R chart, we use R̄. From the table, we see that
![]()
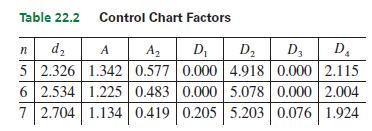
The upper control limit (UCL) and the lower control limit (LCL) for each chart are defined in terms of the mean range R̄ and an appropriate constant taken from a table of control chart factors. These factors, which are related to the sample size n, are determined by statistical considerations found in a more complete coverage of quality control. At the left is a brief table of control chart factors (Table 22.2).
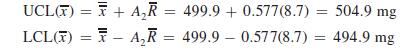
The UCL and LCL for the x chart are found as follows:
The UCL and LCL for the R chart are found as follows:
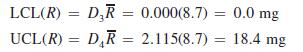
Figure 22.20 shows an x̄−R chart of these data constructed using the statistical software Minitab. The top graph is the x̄ chart and the bottom graph is the R chart. Note that the central lines and control limits agree with the ones we calculated.
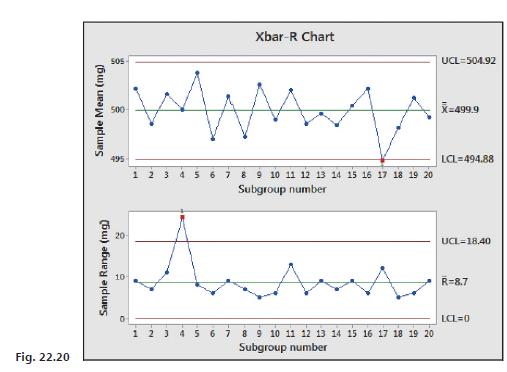
This would be considered a well-centered process since x̄ = 499.9 mg, which is very near the target value of 500.0 mg. We do note, however, that subgroup 17 was slightly outside the lower control limit and this might have been due to some special cause, such as the use of a substandard mixture of ingredients. We also note that the process was out of control due to some special cause of subgroup 4 since the range was above the upper control limit.
Step by Step Answer:

This question has not been answered yet.
You can Ask your question!


Basic Technical Mathematics
ISBN: 9780137529896
12th Edition
Authors: Allyn J. Washington, Richard Evans
