

In Example 2, change x + 3 to 3 x and then draw the graph of
Question:
In Example 2, change x + 3 to 3 − x and then draw the graph of the resulting inequality.
Data from Example 2
Draw a sketch of the graph of the inequality y < x + 3. First, we draw the function y = x + 3, as shown by the dashed line in Fig. 17.38. Because we wish to find all the points that satisfy the inequality y < x + 3, we show these points by shading in the region below the line. The line is shown as a dashed line to indicate that points on it do not satisfy the inequality.
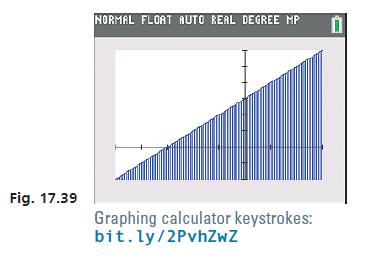
Most calculators can be used to display the solution of an inequality involving two variables by shading a region above a curve, below a curve, or between curves. The manner in which this is done varies according to the model of the calculator. Therefore, the manual should be used to determine how this is done on any particular model of calculator. In Fig. 17.39, such a calculator display is shown for this inequality.
Step by Step Answer:
To change x 3 to 3 x we can subtract x from both sides and then add 3 to both sides giving us the ...View the full answer


Basic Technical Mathematics
ISBN: 9780137529896
12th Edition
Authors: Allyn J. Washington, Richard Evans
