

In Example 4, change the lowest data value from 1.0 to 0.9 and then make a stem-and-leaf
Question:
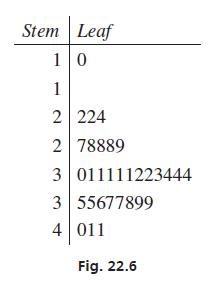
In Example 4, change the lowest data value from 1.0 to 0.9 and then make a stem-and-leaf plot with split stems.
Data from Example 4
In a stem-and-leaf plot, all but the last digit of each data value is called the stem and the last digit is the leaf. The stems are listed vertically with a line separating them from the leaves, which are listed in ascending order. A stem-and-leaf plot of the birth weights given in Example 3 is shown in Fig. 22.5. A “key” should be provided to show how to interpret the place values of the digits since decimal points are never included in this kind of chart. In this case, a typical key would be “leaf digit = 0.1” or “1 0 represents 1.0.”
Sometimes it is useful to split the stems. This means that each stem will be listed twice, with the first stem including leaves 0–4 and the second including leaves 5–9. See Fig. 22.6. Note that the second stem of 1 is included even though there are no leaves. A stem-and leaf plot is like a histogram on its side, and it should show that there is a bit of a gap between the data values 1.0 kg and 2.2 kg.]
Step by Step Answer:
The data from Example 4 is not provided so I will assume that it is the s...View the full answer


Basic Technical Mathematics
ISBN: 9780137529896
12th Edition
Authors: Allyn J. Washington, Richard Evans
