

Make the given changes in the indicated examples of this section and then plot the graphs. In
Question:
Make the given changes in the indicated examples of this section and then plot the graphs.
In Example 4, change the x in the denominator to x − 1.
Data from Example 4
Graph the function
![]()
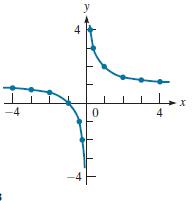
In finding the points on this graph, as shown in Fig. 3.18, note that y is not defined for x = 0, due to division by zero. Thus, x = 0 is not in the domain, and no point on the graph will have an x-coordinate of zero. This means the curve will not cross the y-axis. Although we cannot let x = 0, we can choose other values for x between −1 and 1 that are close to zero. In doing so, we find that as x gets closer to zero, the points get closer to the y-axis, although they do not reach or touch it. In this case, the y-axis is called an asymptote of the curve.
Fig. 3.18.
Step by Step Answer:
To make the given changes in Example 4 we need to change the denominator of the function y 1 1x from ...View the full answer


Basic Technical Mathematics
ISBN: 9780137529896
12th Edition
Authors: Allyn J. Washington, Richard Evans
