A request in the UK parliament (http://www.theyworkforyou.com/wrans/?id=2011-03 (-07 c .44095).h) related to 2009 mortality rates (per 100000
Question:
A request in the UK parliament (http://www.theyworkforyou.com/wrans/?id=2011-03 \(-07 c .44095\).h) related to 2009 mortality rates (per 100000 population) in Wales according to income decile of neighbourhood of residence at time of death (decile 1 is least deprived, and decile 10 is most deprived). The data provided include \(95 \%\) intervals:
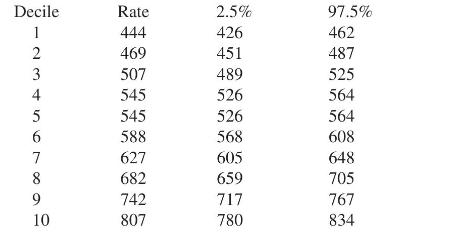
Obtain the known precisions \(h_{t}=1 / \sigma_{t}^{2}(t=1, \ldots, 10)\) at stage 1 , with the rates then \(y_{t} \sim N\left(\theta_{t}, 1 / h_{t}\right)\). At stage 2 apply a RW1 prior for the latent series \(\theta_{t}\) with variance \(\tau^{2}\). Use a uniform shrinkage prior on \(\tau^{2}\) involving the harmonic mean variance \(s_{0}^{2}=\) \(10 / \sum_{t=1}^{10} h_{t}\). Obtain mixed posterior \(\mathrm{p}\)-values by the sequence
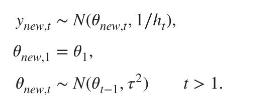
and identify the decile with the highest mixed posterior p-value (also the decile with the greatest shrinkage).
Step by Step Answer: