

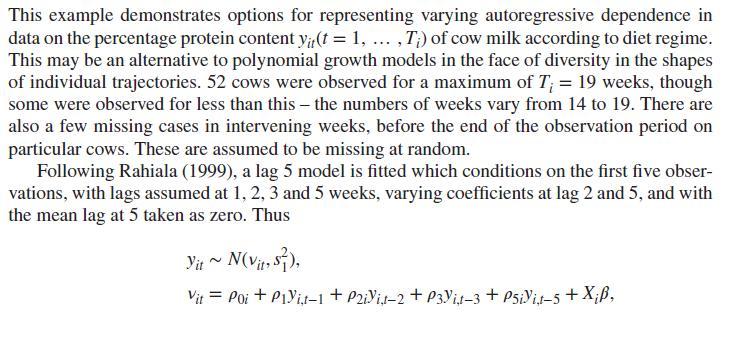
In Example 7.3, assess sensitivity of predictive fit (the sum of squared deviations between observations and predictive
Question:
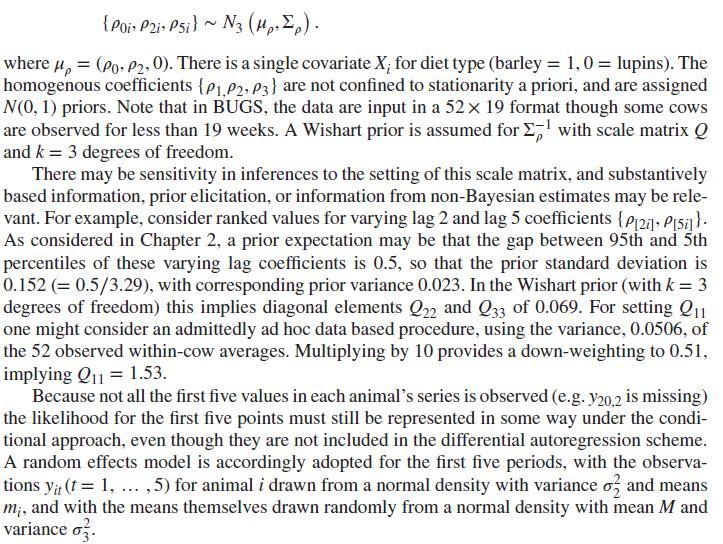
In Example 7.3, assess sensitivity of predictive fit (the sum of squared deviations between observations and predictive replicates) and inferences regarding the diet coefficient \(\beta\) to alternative settings \(Q=k I\) of the prior scale matrix for \(\Sigma_{ho}^{-1}\) under a Wishart prior. For example, a suggestion is to compare the settings \(k=0.001, k=0.1\) and \(k=1\).
Data from Example 7.3
Fantastic news! We've Found the answer you've been seeking!
Step by Step Answer:

Answered By
Carly Cimino
As a tutor, my focus is to help communicate and break down difficult concepts in a way that allows students greater accessibility and comprehension to their course material. I love helping others develop a sense of personal confidence and curiosity, and I'm looking forward to the chance to interact and work with you professionally and better your academic grades.
12+ Reviews
21+ Question Solved
Related Book For 
Question Posted:
