

Add labels to the figure that follows, which illustrates the predicted pattern of changes in human population
Question:
Add labels to the figure that follows, which illustrates the predicted pattern of changes in human population growth rates when death rates fall.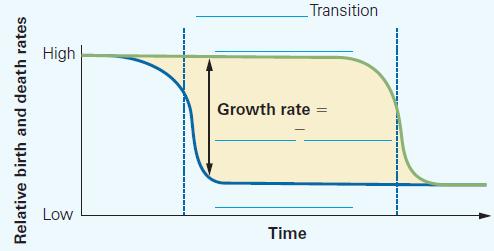
Fantastic news! We've Found the answer you've been seeking!
Step by Step Answer:
Relative birth and death ...View the full answer

Answered By
Vincent Omondi
I am an extremely self-motivated person who firmly believes in his abilities. With high sensitivity to task and operating parameters, deadlines and keen on instructions, I deliver the best quality work for my clients. I handle tasks ranging from assignments to projects.
109+ Reviews
314+ Question Solved
Related Book For 

Biology Science For Life With Physiology
ISBN: 9780134555430
6th Edition
Authors: Colleen Belk, Virginia Maier
Question Posted:
