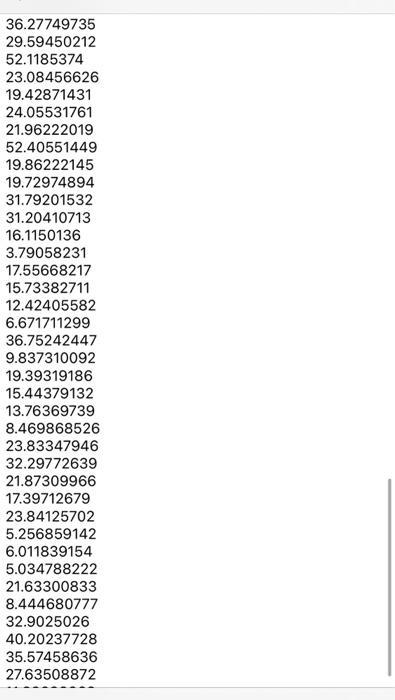
Use the data set assigned to your student ID and design a MATLAB script file to...
Fantastic news! We've Found the answer you've been seeking!
Question:
Transcribed Image Text:
Use the data set assigned to your student ID and design a MATLAB script file to do the following (Hint: save the text file in your main folder and use the command "importdata" in your script file to load the data file: X = importdata('xxxxx.txt'). The vector X will contain the data saved in the text file). 1. Compute and display the mean μ, variance, and the standard deviation of the data. (8 marks) 2. Generate (but do not display) the probability density function (PDF) and the cumulative distribution function (CDF) that represents the data. (8 marks) (8 marks) 3. Plot both PDF and CDF functions. 4. Compute the following probabilities: a. P(X> μ+20) (5 marks) b. Pu-o≤x≤μ+20) (5 marks) s. If the random variable X is transformed according to the linear transformation Y= a X+b where a and b are constants: a. For a=2 and b=3, find the mean and the variance of the random variable Y and display them. (4 marks) b. Generate and plot the probability density function (PDF) for Y. (3 marks) c. Design a for loop to plot the probability density of the random variable Y for the range of a and b as follows: a = 1:2:10 and b = 0:2:10. (5 marks) 11.23470946 23.46151668 -0.403588512 5.756052378 21.50532472 24.52642002 24.95547574 17.9893142 18.86940454 3.727375851 16.83716932 16.90711841 11.07443688 34.64076071 28.31971556 14.6570928 3.010319261 12.02370752 19.63201297 32.29156739 23.40156281 8.027527627 8.44546806 19.21139352 5.352365552 18.88768463 30.04838955 13.06659393 17.78238599 9.914190238 23.11742165 19.16762279 50.62287481 26.65103391 19.13660718 45.02611492 40.81907098 14.66840003 21.89934645 0.216496183 17.39160691 16.59876377 -15.97347607 14.60033387 38.53916276 26.87044508 12.31891487 11.07041775 4.745791003 1.047149647 35.10492789 51.50634374 4.269365075 16.65591343 27.40431385 31.76091094 22.15811858 11.0968454 15.29209873 28.92701741 34.02595923 7.371927845 12.01572796 5.367976216 13.22323134 11.52957434 30.69333394 26.97126199 49.22101725 13.53826301 18.01624751 6.794056085 5.605428871 22.90046377 9.463333462 23.8416922 20.39955003 19.16777546 14.9546053 21.12387497 4.555604519 36.83691296 15.23016253 3.936893159 17.74961607 43.91836523 27.09297039 34.2235511 20.56525422 6.175328743 0.261508644 22.70499427 7.53066545 31.7656561 11.99032815 26.88877859 22.25712821 0.771069331 15.22335797 24.25900378 5.845089283 52.7796059 12.49517315 49.56439494 0.1847136 17.1159322 33.14019132 17.70727556 20.76484735 -12.42269396 8.691557274 26.4927226 39.61065004 36.27749735 29.59450212 52.1185374 23.08456626 19.42871431 24.05531761 21.96222019 52.40551449 19.86222145 19.72974894 31.79201532 31.20410713 16.1150136 3.79058231 17.55668217 15.73382711 12.42405582 6.671711299 36.75242447 9.837310092 19.39319186 15.44379132 13.76369739 8.469868526 23.83347946 32.29772639 21.87309966 17.39712679 23.84125702 5.256859142 6.011839154 5.034788222 21.63300833 8.444680777 32.9025026 40.20237728 35.57458636 27.63508872 11.83698668 Use the data set assigned to your student ID and design a MATLAB script file to do the following (Hint: save the text file in your main folder and use the command "importdata" in your script file to load the data file: X = importdata('xxxxx.txt'). The vector X will contain the data saved in the text file). 1. Compute and display the mean μ, variance, and the standard deviation of the data. (8 marks) 2. Generate (but do not display) the probability density function (PDF) and the cumulative distribution function (CDF) that represents the data. (8 marks) (8 marks) 3. Plot both PDF and CDF functions. 4. Compute the following probabilities: a. P(X> μ+20) (5 marks) b. Pu-o≤x≤μ+20) (5 marks) s. If the random variable X is transformed according to the linear transformation Y= a X+b where a and b are constants: a. For a=2 and b=3, find the mean and the variance of the random variable Y and display them. (4 marks) b. Generate and plot the probability density function (PDF) for Y. (3 marks) c. Design a for loop to plot the probability density of the random variable Y for the range of a and b as follows: a = 1:2:10 and b = 0:2:10. (5 marks) 11.23470946 23.46151668 -0.403588512 5.756052378 21.50532472 24.52642002 24.95547574 17.9893142 18.86940454 3.727375851 16.83716932 16.90711841 11.07443688 34.64076071 28.31971556 14.6570928 3.010319261 12.02370752 19.63201297 32.29156739 23.40156281 8.027527627 8.44546806 19.21139352 5.352365552 18.88768463 30.04838955 13.06659393 17.78238599 9.914190238 23.11742165 19.16762279 50.62287481 26.65103391 19.13660718 45.02611492 40.81907098 14.66840003 21.89934645 0.216496183 17.39160691 16.59876377 -15.97347607 14.60033387 38.53916276 26.87044508 12.31891487 11.07041775 4.745791003 1.047149647 35.10492789 51.50634374 4.269365075 16.65591343 27.40431385 31.76091094 22.15811858 11.0968454 15.29209873 28.92701741 34.02595923 7.371927845 12.01572796 5.367976216 13.22323134 11.52957434 30.69333394 26.97126199 49.22101725 13.53826301 18.01624751 6.794056085 5.605428871 22.90046377 9.463333462 23.8416922 20.39955003 19.16777546 14.9546053 21.12387497 4.555604519 36.83691296 15.23016253 3.936893159 17.74961607 43.91836523 27.09297039 34.2235511 20.56525422 6.175328743 0.261508644 22.70499427 7.53066545 31.7656561 11.99032815 26.88877859 22.25712821 0.771069331 15.22335797 24.25900378 5.845089283 52.7796059 12.49517315 49.56439494 0.1847136 17.1159322 33.14019132 17.70727556 20.76484735 -12.42269396 8.691557274 26.4927226 39.61065004 36.27749735 29.59450212 52.1185374 23.08456626 19.42871431 24.05531761 21.96222019 52.40551449 19.86222145 19.72974894 31.79201532 31.20410713 16.1150136 3.79058231 17.55668217 15.73382711 12.42405582 6.671711299 36.75242447 9.837310092 19.39319186 15.44379132 13.76369739 8.469868526 23.83347946 32.29772639 21.87309966 17.39712679 23.84125702 5.256859142 6.011839154 5.034788222 21.63300833 8.444680777 32.9025026 40.20237728 35.57458636 27.63508872 11.83698668
Expert Answer:
Answer rating: 100% (QA)
Answer The code is as follow Load data from the text file X importdataxxxxxtxt 1 Compute and display ... View the full answer
Related Book For
Using Microsoft Excel and Access 2016 for Accounting
ISBN: 978-1337109048
5th edition
Authors: Glenn Owen
Posted Date:
Students also viewed these electrical engineering questions
-
How has the U.S. corrections system changed in terms of philosophies of punishment? Do you believe the change has been positive or negative?
-
In the book Advanced Managerial Accounting, Robert P. Magee discusses monitoring cost variances. A cost variance is the difference between a budgeted cost and an actual cost. Magee describes the...
-
1. Why is the following not ideal? /* implementation of a lock */ void lock () { DisableInterrupts (); } void unlock (0 { EnableInterrupts (); } /* a process that accesses some shared data */ Process...
-
Molybdenum forms a substitutional solid solution with tungsten. Compute the weight percent of molybdenum that must be added to tungsten to yield an alloy that contains 1.0 10 22 Mo atoms per cubic...
-
Show that the Schwarzschild radius for Earth is 8.9 mm.
-
Let A be a fixed positive constant, and define the function f(x) by f(x) = 1/2 e- x if x > 0 and f(x) = 1/2 ex if x < 0. (a) Verify that f(x) is a pdf. (b) If A" is a random variable with pdf given...
-
The board of directors of Changing Seasons Health Spa authorizes the issuance of \(\$ 600,000\) of \(7 \%, 10\)-year bonds payable. The semiannual interest dates are May 31 and November 30. The bonds...
-
Beginning inventory, purchases, and sales for WCS12 are as follows: Assuming a perpetual inventory system and using the weighted average method, determine (a) The weighted average unit cost after the...
-
Explain the organisational profile of Bank of Nova Scotia? Explain the sales and marketing objectives of Bank of Nova Scotia? Explain the situational analysis of Bank of Nova Scotia? Describe the...
-
On March 1, 2008, Ginny Tyler established Seltzer Realty. Ginny completed the following transactions during the month of March: a. Opened a business bank account with a deposit of $30,000 from...
-
Suppose an economy produces only wheat and rice. Last year, 20 bushels of wheat are sold at $4 per bushel, and 10 bushels of rice are sold at $2 per bushel. If the price of wheat was $2 per bushel...
-
The average power density produced by the transducer radiating into the dat is 10 mW/cm 2 . If the area pf the transducer is 10 cm 2 and its frequency is 3MHz, determine how much average power will...
-
Ancilla (mass 57 kg) goes skydiving. At one point in her descent, the force of air resistance on Ancilla and her parachute is 670 N [up]. (a) What is the force of gravity on Ancilla? (b) What is the...
-
A baseball bat has 120 J of kinetic energy as it hits a baseball (m = 0.145 kg). (a) If the baseball bat transfers 70 J of its kinetic energy to the baseball, what is the efficiency of the energy...
-
Francesca is a departmental manager in the women's wear department for The Bay. She believes that if she places her line of $100 dresses on sale at 30% off, she would see her sales rise by 79%. The...
-
Ancilla (mass 57 kg) goes skating with Wayne Gretzky (mass 83 kg). At one point when both are standing motionless on the ice, she gives Wayne a push of 200 N [S]. (a) What is Wayne's acceleration?...
-
A sheet of cardboard is a square with each side 60" in length. The cardboard will be folded into a box with a lid, after four squares and two rectangular areas are removed (see diagram). What should...
-
Establish identity. cos( + k) = (-1)k cos , k any integer
-
Explain the importance of parentheses in formulas.
-
Using the Ch12-02 file, modify the Buyers form for What SUP so that it looks like Figure 12.40. Save this form as Ch 12 Assignment 1, and print record 1 using this form.
-
Describe the process of adding lines to a report.
-
Assume that an account has the following characteristics: Number of items in the account-300 Recorded amount- \(\$ 600,000\) Sample size-100 Required: a. If the sample mean is \(\$ 1,800\) and mean...
-
You desire to estimate the amount of the inventory of your client. Draper. Inc. You satisfied yourself earlier as to the inventory quantities. During the audit of the pricing and extension of the...
-
The following data for a substantive test using sampling are available: Population recorded amount- \(\$ 200,000\) Tolerable misstatement \(\$ 10,000\) Number of items in the population-200 Risk of...
Study smarter with the SolutionInn App