

A scatterplot shows relationships between variables. The following scatterplot graphs the relationship between number of users in
Question:
A scatterplot shows relationships between variables. The following scatterplot graphs the relationship between number of users in the system and system response time. Correlation determines the extent to which variables are related to each other. Which variable is the X value? Which variable is the Y variable? How are these data points related?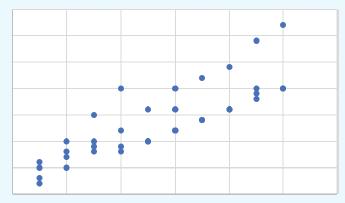
Fantastic news! We've Found the answer you've been seeking!
Step by Step Answer:
The X variable is number ...View the full answer

Answered By
Branice Buyengo Ajevi
I have been teaching for the last 5 years which has strengthened my interaction with students of different level.
1+ Reviews
10+ Question Solved
Related Book For 

Introduction To Business Analytics
ISBN: 9781265454340
1st Edition
Authors: Vernon Richardson, Marcia Watson
Question Posted:
