Examine the data visualization below. Is it a histogram or a bar chart? How can you? Total
Question:
Examine the data visualization below. Is it a histogram or a bar chart? How can you?
Transcribed Image Text:
Total Sales 2,000,000 1,500,000 1,000,000 500,000 North Total Sales by Region South Region East West
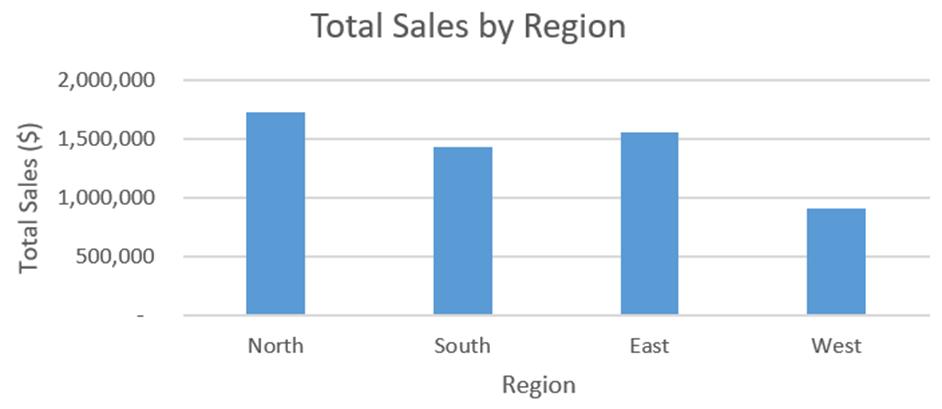
Fantastic news! We've Found the answer you've been seeking!
Step by Step Answer:
Answer rating: 75% (4 reviews)
It is a bar chart because the bars have spaces between t...View the full answer
Answered By
Caroline Kinuthia
Taking care of the smaller details in life has a larger impact in our general well being, and that is what i believe in. My name is Carol. Writing is my passion. To me, doing a task is one thing, and delivering results from the task is another thing. I am a perfectionist who always take things seriously and deliver to the best of my knowledge.
4.90+
1933+ Reviews
4269+ Question Solved
Related Book For
Introduction To Business Analytics
ISBN: 9781265454340
1st Edition
Authors: Vernon Richardson, Marcia Watson
Question Posted:
Students also viewed these Business questions
-
How do histograms and polygons differ in construction and use? Choose the correct choice below. A. A histogram uses bars to represent each class while a polygon uses a single point. The polygon...
-
Use the data visualization methods presented in this chapter to explore these data and discover relationships between the variables. Include the following, in your report: 1. Create a scatter chart...
-
The Economic Stimulus Act of 2008 and the American Economic Recovery and Reinvestment Act of 2009 where the latest big experiments the U.S. has undertaken with large-scale fiscal stimulus. Recall...
-
1. Review the six (6) goals of performance based acquisition(s); choose two and discuss how your choices can be implemented for effective management of contracts, using an actual or theoretical...
-
Davidson, DDS, purchased new furniture for its store on May 1, 2011. The furniture is expected to have a 10-year life and no residual value. The following expenditures were associated with the...
-
In problem, find the slope and y-intercept of each line. Graph the line. x + y = 1
-
The plaintiff, Thelma Agnes Smith, lived with the defendant out of wedlock for several years. When the relationship ended, she sued the defendant, seeking to enforce two written agreements with him...
-
Mohave Corp. is considering outsourcing production of the umbrella tote bag included with some of its products. The company has received a bid from Willow Co. to produce 8,000 units per year for...
-
Research Web-based database technologies and identify a database management system (other than SQL Server, MySQL, or Oracle) that is used to deploy applications to the Web and the cloud. Discuss the...
-
Match the data visualization with the type of business analytics (descriptive, diagnostic, predictive, or prescriptive) it is most associated with. Data Visualization Scatterplot Times series data...
-
Exploratory, diagnostic analytics includes which type of visualizations? a. Box plots b. Scatterplots c. Pivot charts d. Times series graphs
-
Ninety-one out of 220 people working as cast and crew of the movie The Conqueror, which was filmed in 1955 downwind from nuclear bomb tests, ultimately contracted cancer (see Practice Problem 5 in...
-
The x-component of vector A can be calculated as: A. Ax= 100 NX sin 40 B. Ax= 100 NX cos 40 D C. Ax = D. Ax = Choice A Choice B Choice C Choice D 100 N sin 40 100 N cos 40 30% B (80 N) (100 N) 40 X
-
A wheel of radius R is rolling on a horizontal surface. Its center is moving forward with speed v. A point on the wheel a distance r/3 below the center is moving forward at a speed 2v/3. The wheel is...
-
A particle undergoes a constant acceleration of 4.60 m/s. After a certain amount of time, its velocity is 12.4 m/s. (Where applicable, indicate the direction with the sign of your answer.) (a) If its...
-
Two cars are approaching each other at the same speed: 16 m/s. Car A has a mass of 1400 kg and Car B has a mass of 1000 kg. What is the final momentum of the cars after they collide and stick...
-
If you double the length of a pendulum, the period will double. a) True b) False
-
In problem 3-2, suppose that a cost is imposed of an amount equal to the square of the number of additional hours of sleep. What is the expected cost? Explain. X P(x) 0 ..... 0.01 1 ..... 0.09 2...
-
Ex. (17): the vector field F = x i-zj + yz k is defined over the volume of the cuboid given by 0x a,0 y b, 0zc, enclosing the surface S. Evaluate the surface integral ff, F. ds?
-
Use Holts method to create a model that minimizes the MSE for the data set. Use Solver to determine the optimal values of a and b. a. What are the optimal values of a and b? b. Prepare a line graph...
-
Use Holt-Winters additive method to create a seasonal model that minimizes the MSE for the data set. Use Solver to determine the optimal values of a, b, and g. a. What are the optimal values of a, b,...
-
Use Holt-Winters multiplicative method to create a seasonal model that minimizes the MSE for the data set. Use Solver to determine the optimal values of a, b, and g. a. What are the optimal values of...
-
Hello, can you add to my paap,r below. The prompt: Compare the U.S. Supreme Court with the other two courts in the U.S. federal court system. What i have so far: The supreme court is the highest in...
-
Previous tax law had limits on charitable giving, as does the present law. However, the new tax law raised the standard deduction for all individual taxpayers. Will this have an effect on charitable...
-
Briefly discuss the legal environment in which the rules and principles of Australian tax law operate, basics of the Australian legal system as they apply to Australian tax law, Constitutional...
Study smarter with the SolutionInn App