

Lets analyze the transactions by product (SKU). Create a pivot table in Excel showing how many units
Question:
Let’s analyze the transactions by product (SKU). Create a pivot table in Excel showing how many units were sold for each SKU. Use the pivot table to answer the following questions:
a. Which product (SKU) sold the most units?
b. Which product (SKU) sold the fewest units?
c. Using PivotChart, create the recommended Cluster Column chart showing the number of products sold for each SKU. Is the chart a histogram or a bar chart? Explain your answer.
Pivot table 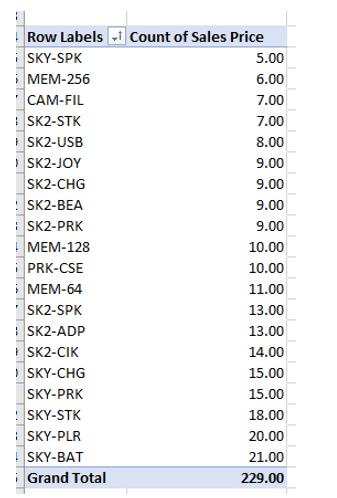
Fantastic news! We've Found the answer you've been seeking!
Step by Step Answer:
a SKYBAT b SKYBAT c Count of Sales Price 2500 2000 1500 100...View the full answer

Answered By
WAHIDUL HAQUE
hello,
I'm a professional academic solution provider working as a freelance academic solution provider since 7 years. I have completed numerous projects. Help lots of students to get good marks in their exams and quizzes. I can provide any type of academic help to your homework, classwork etc, if you are a student of Accounting, Finance, Economics, Statistics. I believe in satisfying client by my work quality, rather than making one-time profit. I charge reasonable so that we make good long term relationship. why will you choose me? i am an extremely passionate, boldly honest, ethically driven and pro-active contractor that holds each of my clients in high regards throughout all my business relations. in addition, I'll always make sure that I'm giving my 100% better in every work that will be entrusted to me to be able to produce an outcome that will meet my client's standards. so if you are a student that is now reading my profile and considering me for your academic help. please feel free to look through my working history, feedback and contact me if you see or read something that interests you. I appreciate your time and consideration.
regards
233+ Reviews
368+ Question Solved
Related Book For 
Introduction To Business Analytics
ISBN: 9781265454340
1st Edition
Authors: Vernon Richardson, Marcia Watson
Question Posted:
