

The following 20 observations are for two quantitative variables, x and y. a. Create a scatter chart
Question:
The following 20 observations are for two quantitative variables, x and y.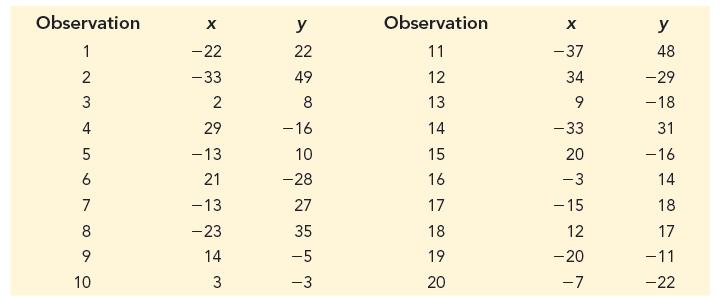
a. Create a scatter chart for these 20 observations.
b. Fit a linear trendline to the 20 observations. What can you say about the relationship between the two quantitative variables?
Fantastic news! We've Found the answer you've been seeking!
Step by Step Answer:

Answered By
OTIENO OBADO
I have a vast experience in teaching, mentoring and tutoring. I handle student concerns diligently and my academic background is undeniably aesthetic
3+ Reviews
10+ Question Solved
Related Book For 

Business Analytics
ISBN: 9780357902219
5th Edition
Authors: Jeffrey D. Camm, James J. Cochran, Michael J. Fry, Jeffrey W. Ohlmann
Question Posted:
