

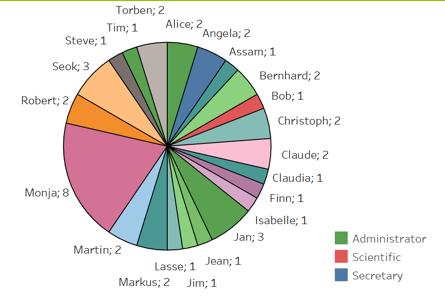
The following pie chart shows how frequently each employees computer at HackUsNow has been hacked. Evaluate the
Question:
The following pie chart shows how frequently each employee’s computer at HackUsNow has been hacked. Evaluate the pie chart assuming that the analyst is trying to answer this question: “Which employees’ computers were hacked the most?” Does the pie chart answer the question? What recommendations do you suggest for improving this pie chart?
Fantastic news! We've Found the answer you've been seeking!
Step by Step Answer:
The pie chart is poorly designed for the following reasons 1 There are too many employees to fit ...View the full answer

Answered By
Sigei Kipngeno
I am a professional writer with more than 2 years of writing experience. I will always deliver a grade A paper with zero plagiarism . Thanks in advance.
175+ Reviews
311+ Question Solved
Related Book For 

Introduction To Business Analytics
ISBN: 9781265454340
1st Edition
Authors: Vernon Richardson, Marcia Watson
Question Posted:
