

The following stock chart shows stock price performance for Coca-Cola over a two-week period. Note that May
Question:
The following stock chart shows stock price performance for Coca-Cola over a two-week period. Note that May 16 and May 17 are a Saturday and a Sunday and are non-trading days.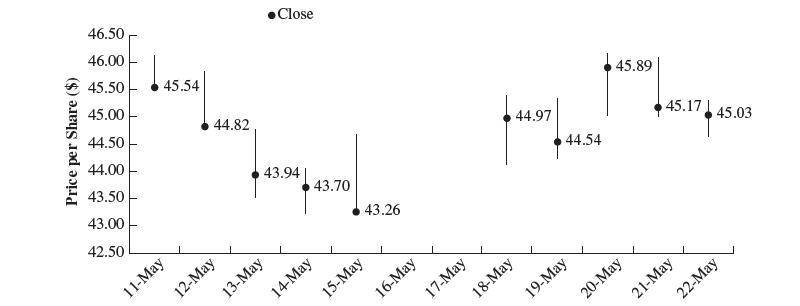
a. Which day seems to have the most intra-day price variability?
b. What is the closing price on May 22?
c. If you bought 100 shares at the closing price on May 19 and sold all of those shares at the closing price on May 22, how much did you gain or lose (ignoring any transaction fees)?
Fantastic news! We've Found the answer you've been seeking!
Step by Step Answer:

Answered By
ANDREW KIPRUTO
Academic Writing Expert
I have over 7 years of research and application experience. I am trained and licensed to provide expertise in IT information, computer sciences related topics and other units like chemistry, Business, law, biology, biochemistry, and genetics. I'm a network and IT admin with +8 years of experience in all kind of environments.
I can help you in the following areas:
Networking
- Ethernet, Wireless Airmax and 802.11, fiber networks on GPON/GEPON and WDM
- Protocols and IP Services: VLANs, LACP, ACLs, VPNs, OSPF, BGP, RADIUS, PPPoE, DNS, Proxies, SNMP
- Vendors: MikroTik, Ubiquiti, Cisco, Juniper, HP, Dell, DrayTek, SMC, Zyxel, Furukawa Electric, and many more
- Monitoring Systems: PRTG, Zabbix, Whatsup Gold, TheDude, RRDtoo
Always available for new projects! Contact me for any inquiries
1+ Reviews
10+ Question Solved
Related Book For 

Business Analytics
ISBN: 9780357902219
5th Edition
Authors: Jeffrey D. Camm, James J. Cochran, Michael J. Fry, Jeffrey W. Ohlmann
Question Posted:
