

The following table provides statistics on injuries (U.S. Census Bureau, 2010, p. 197). Study the table, then
Question:
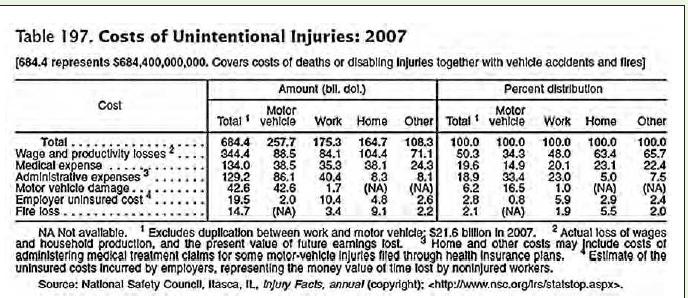
The following table provides statistics on injuries (U.S.
Census Bureau, 2010, p. 197). Study the table, then perform the following tasks:
a. Create two different graphics, each of which communicates information about the cost of lost wages and productivity.
b. Create two different graphics, each of which compares wage and productivity losses to the total of other losses due to unintentional injuries.
Fantastic news! We've Found the answer you've been seeking!
Step by Step Answer:

Answered By
Pushpinder Singh
Currently, I am PhD scholar with Indian Statistical problem, working in applied statistics and real life data problems. I have done several projects in Statistics especially Time Series data analysis, Regression Techniques.
I am Master in Statistics from Indian Institute of Technology, Kanpur.
I have been teaching students for various University entrance exams and passing grades in Graduation and Post-Graduation.I have expertise in solving problems in Statistics for more than 2 years now.I am a subject expert in Statistics with Assignmentpedia.com.
3+ Reviews
10+ Question Solved
Related Book For 

Practical Strategies For Technical Communication
ISBN: 9781457653788
1st Edition
Authors: Mike Markel
Question Posted:
