

Hoping to reduce the variability of the final exam scores in his business statistics classes, an instructor
Question:
Hoping to reduce the variability of the final exam scores in his business statistics classes, an instructor at Miami University in Oxford, Ohio, developed a new set of PowerPoint presentations to use in his classes. One business statistics section was taught using the instructor’s old notes and a second section was taught using the new PowerPoint presentations. The final exam scores earned by the students in the two sections are given in the following table.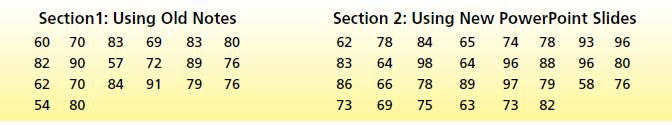
Assuming that these two sections represent approximately independent random samples of students, and assuming approximate normality, test to see if the new PowerPoint presentations have reduced the variability of the final exam scores at the .05 level of significance. Explain your conclusion.
Step by Step Answer:
so we fail to reject the null hy...View the full answer


Business Statistics In Practice
ISBN: 9780077534844
7th Edition
Authors: Bruce Bowerman, Richard OConnell, Emilly Murphree
