

The data in Table 14.6 concerning the relationship between smoking and lung cancer death are presented in
Question:
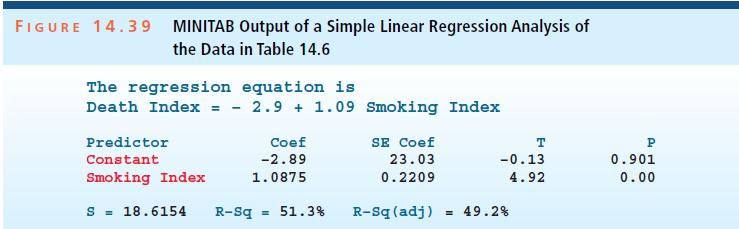
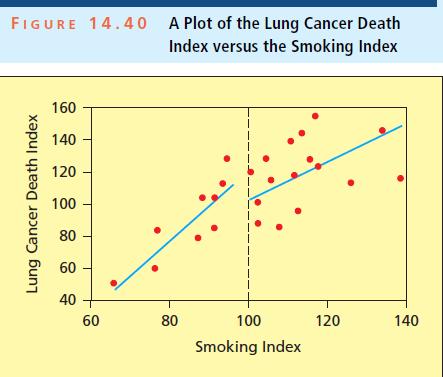
The data in Table 14.6 concerning the relationship between smoking and lung cancer death are presented in a course of The Open University, Statistics in Society, Unit C4, The Open University Press, Milton Keynes, England, 1983. The original source of the data is Occupational Mortality: The Registrar General’s Decennial Supplement for England and Wales, 1970–1972, Her Majesty’s Stationery Office, London, 1978. In the table, a smoking index greater (less) than 100 indicates that men in the occupational group smoke more (less) than average when compared to all men of the same age. Similarly, a lung cancer death index greater (less) than 100 indicates that men in the occupational group have a greater (less) than average lung cancer death rate when compared to all men of the same age. In Figure 14.39 we present a portion of a MINITAB output of a simple linear regression analysis relating the lung cancer death index to the smoking index. In Figure 14.40 we present a plot of the lung cancer death index versus the smoking index.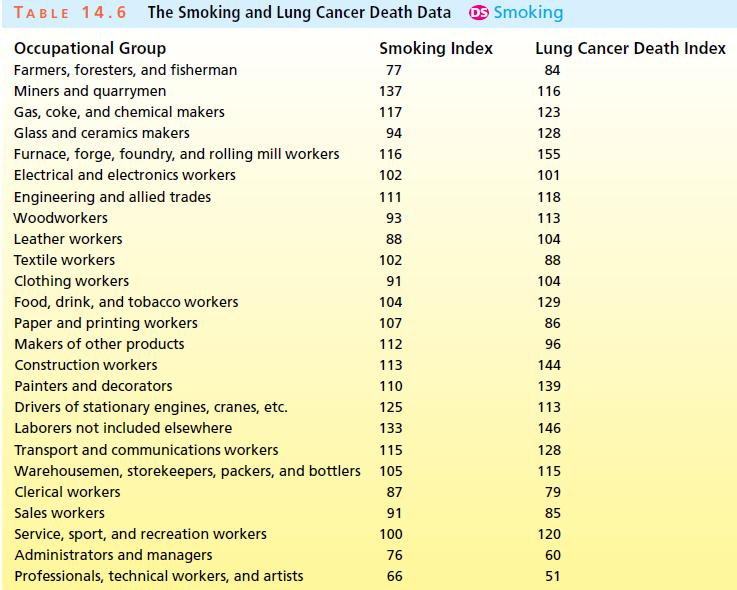
a. Although the data do not prove that smoking increases your chance of getting lung cancer, can you think of a third factor that would cause the two indexes to move together?
b. Does the slope of the hypothetical line relating the two indexes when the smoking index is less than 100 seem to equal the slope of the hypothetical line relating the two indexes when the smoking index is greater than 100? If you wish, use simple linear regression to make a more precise determination. What practical conclusion might you make?
Step by Step Answer:

This question has not been answered yet.
You can Ask your question!


Business Statistics In Practice
ISBN: 9780077534844
7th Edition
Authors: Bruce Bowerman, Richard OConnell, Emilly Murphree
