

The following data represents the pounds per capita of fresh food and packaged food consumed in the
Question:
The following data represents the pounds per capita of fresh food and packaged food consumed in the United States, Japan, and Russia in a recent year.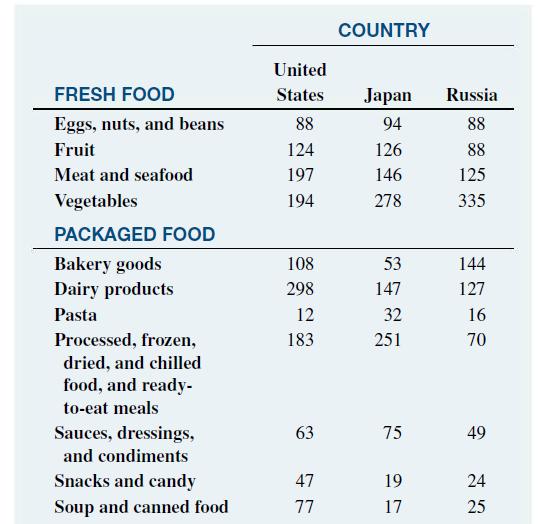
a. For each of the three countries, construct a bar chart, a pie or doughnut chart, and a Pareto chart for different types of fresh foods consumed.
b. For each of the three countries, construct a bar chart, a pie or doughnut chart, and a Pareto chart for different types of packaged foods consumed.
c. What conclusions can you reach concerning differences between the United States, Japan, and Russia in the fresh foods and packaged foods consumed?
Fantastic news! We've Found the answer you've been seeking!
Step by Step Answer:
a United States Fresh Food Consumed Japan Fresh Food Consumed Russia Fresh Food Consumed b United ...View the full answer

Answered By
Muhammad Haroon
More than 3 years experience in teaching undergraduate and graduate level courses which includes Object Oriented Programming, Data Structures, Algorithms, Database Systems, Theory of Automata, Theory of Computation, Database Administration, Web Technologies etc.
3+ Reviews
10+ Question Solved
Related Book For 

Business Statistics A First Course
ISBN: 9780135177785
8th Edition
Authors: David M. Levine, Kathryn A. Szabat, David F. Stephan
Question Posted:
