

The following table shown in the file TextbookCosts shows the breakdown of the costs of a typical
Question:
The following table shown in the file TextbookCosts shows the breakdown of the costs of a typical college textbook.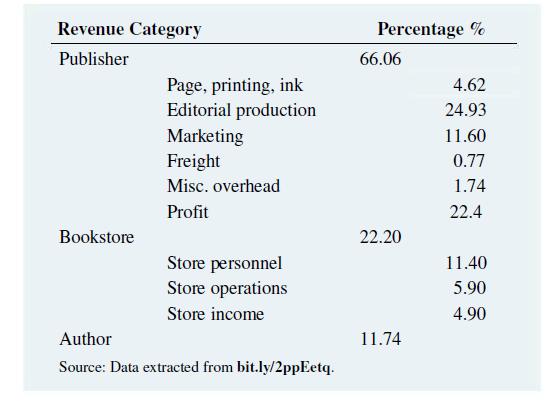
a. Using the categories of publisher, bookstore, and author, construct a bar chart, a pie chart, and a Pareto chart.
b. Using the subcategories of publisher and the subcategories of bookstore, along with the author category, construct a Pareto chart.
c. Based on the results of (a) and (b), what conclusions can you reach concerning who gets the revenue from the sales of new college textbooks? Do any of these results surprise you? Explain.
Fantastic news! We've Found the answer you've been seeking!
Step by Step Answer:
a b c The publisher gets the largest portion 6606 of the revenue 2493 is editorial production m...View the full answer

Answered By
Allan Simiyu
I am an adroit Writer. I am a dedicated writer having worked as a writer for 3 years now. With this, I am sure to ace in the field by helping students break down abstract concepts into simpler ideas.
8+ Reviews
54+ Question Solved
Related Book For 
Business Statistics A First Course
ISBN: 9780135177785
8th Edition
Authors: David M. Levine, Kathryn A. Szabat, David F. Stephan
Question Posted:
