

A financial analyst wants to compare the performance of the stocks of two Internet companies, Amazon (AMZN)
Question:
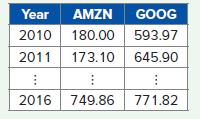
A financial analyst wants to compare the performance of the stocks of two Internet companies, Amazon (AMZN) and Google (GOOG). She records the average closing prices of the two stocks for the years 2010 through 2016. A portion of the data is shown in the accompanying table. Construct a line chart that shows the movements of the two stocks over time using two lines each with a unique color. Describe the overall trend of price movement for the two stocks. Which stock shows the greater trajectory of price appreciation?
Fantastic news! We've Found the answer you've been seeking!
Step by Step Answer:
Google has an upward trend with the exception of a ...View the full answer

Answered By
Muhammad Umair
I have done job as Embedded System Engineer for just four months but after it i have decided to open my own lab and to work on projects that i can launch my own product in market. I work on different softwares like Proteus, Mikroc to program Embedded Systems. My basic work is on Embedded Systems. I have skills in Autocad, Proteus, C++, C programming and i love to share these skills to other to enhance my knowledge too.
1+ Reviews
10+ Question Solved
Related Book For 

Business Analytics Communicating With Numbers
ISBN: 9781260785005
1st Edition
Authors: Sanjiv Jaggia, Alison Kelly, Kevin Lertwachara, Leida Chen
Question Posted:
